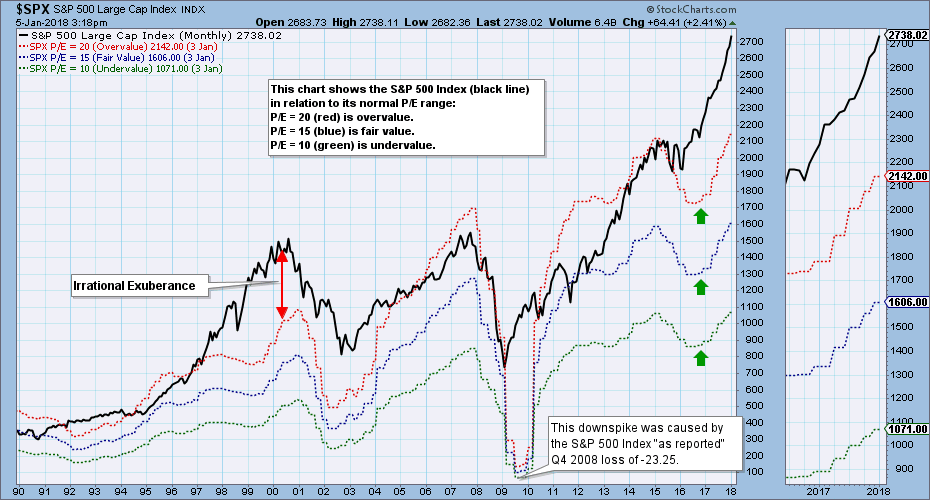
Earnings for 2017 Q3 will be finalized soon, but on a preliminary basis the S&P 500 has a P/E of 25, which is extremely overvalued. The chart below shows the S&P 500 Index (black line) in relation to where it would be if it were undervalued (P/E 10 - green line), fair value (P/E 15 - blue line), or overvalued (P/E 20 - red line). Price moved well above that range over two years ago, just before the current cyclical bull market began.
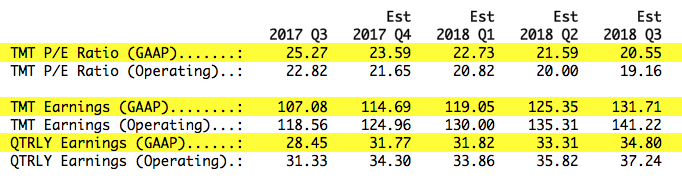
Earnings growth through 2018 Q3 will bring the P/E down to 21, but only if price goes no higher. If the bull market advance continues, overvaluation will continue to be a problem. The table below shows twelve-month trailing (TMT) earnings estimates through 2018 Q3. The P/E estimates are calculated based upon the current price of the S&P 500. I have highlighted the GAAP (Generally Accepted Accounting Principals) numbers, which represent the real world.
 Source: http://us.spindices.com
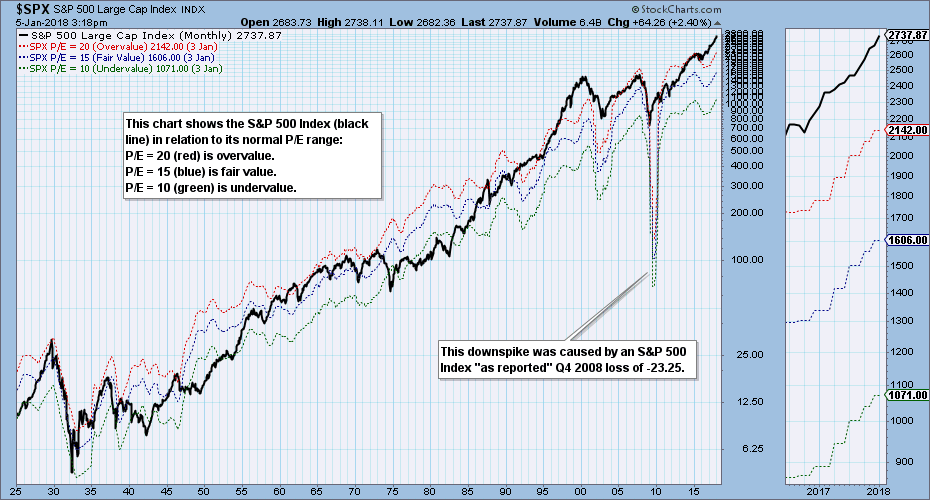
The chart below presents a long-term view of price relative to the normal valuation range of 10 to 20. Since the late-1990s there has been a persistent tendency toward overvaluation, and it has been 35 years since the market was at or below the undervalued side of the range. Note that there are basically two factors that will work to correct this situation: (1) Earnings could grow sufficiently for the range to catch up with price, or (2) price could decline back into the range. Of course, there are combinations of those factors that could bring the desired result.
Important! Because the tax reform bill just passed a few weeks ago, I do not believe that the effect of the corporate tax rate cut has been factored into the estimates, so I expect to see a sharp upward adjustment of the valuation range once that happens. The first quarter to be affected will be 2018 Q1.
The only other time that the market has been this overvalued was near the 2000 top, but it was really extreme with a P/E of around 45, if memory serves, so the P/E would have to go quite a bit higher to challenge historical highs. However, the new, lower corporate tax rates -- 40% lower than last year -- should have the effect of lowering the P/E when earnings are boosted by the tax savings. To clarify, earnings estimates are "pre-tax", so the performance boost will come when companies are able to roll the tax savings back into the business. I don't know what that is going to look like on our chart, but the picture should be much improved once 2018 Q1 finals are posted at the end of June.
Happy Charting!
- Carl
Technical Analysis is a windsock, not a crystal ball.
**Don't miss DecisionPoint Commentary! Add your email below to be notified of new updates"**
Helpful DecisionPoint Links:
DecisionPoint Shared ChartList and DecisionPoint Chart Gallery
Price Momentum Oscillator (PMO)
Swenlin Trading Oscillators (STO-B and STO-V)


