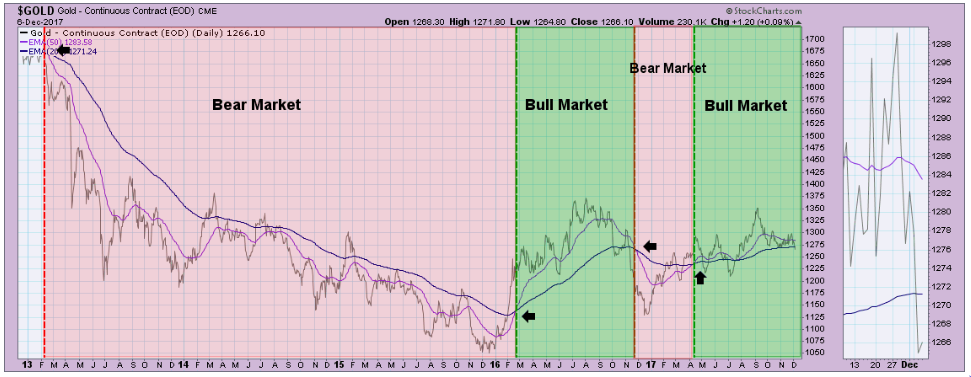
Today on MarketWatchers LIVE, I did a workshop on bull and bear market rules. You'll hear many technicians discuss "bull market rules apply" or vice versa. The question is pertinent and timely right now. The jury is still out on whether we are about to enter a bear market phase but that doesn't mean that you don't want to think about 'bear market rules'. We are currently in a bull market. Based on DecisionPoint timing signals, the 50-EMA is above the 200-EMA. However, what about the correction?
Let's quickly consider what constitutes a bull or bear market. As I said, objectively we can use the 50/200-EMA locations as below.
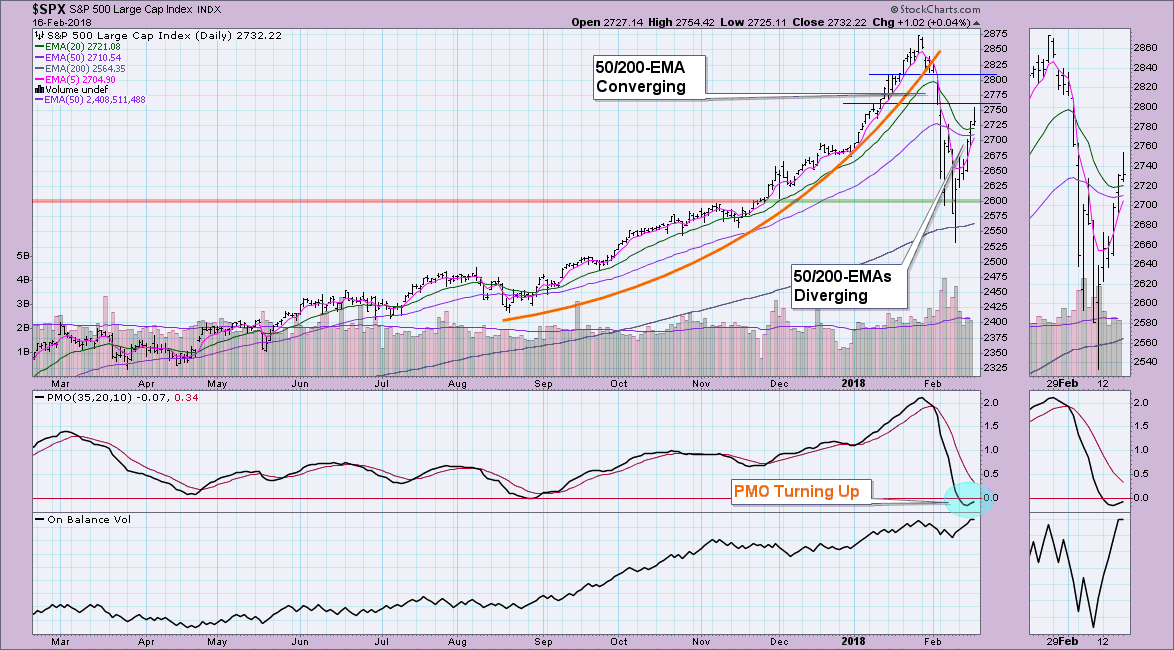
But what do we do when we have a market where the 50-EMA is so far above the 200-EMA? We know we won't see the negative crossover for some time even if the market dropped considerably more. What we do is look at whether these EMAs are converging or diverging. Also, we can watch what the 20/50-EMAs are doing. Let's look at the SPX chart for some help.
We didn't get much warning, but the PMO did turn down and log a SELL signal before the largest drop. Also, after the big drop, we saw the 50/200-EMAs converging. That was when I felt bear market rules needed to apply. The 20-EMA and 50-EMA began converging when price dropped below the 20-EMA and then it dropped below the 50-EMA. All bearish signs, but they may not materialize into a full-blown bear market. However, I need to take precautions by following bear market rules given the drop well below the 50-EMA.
What are bear market rules?
Bear Market Rules:
* Overbought Conditions tell us to expect a new down leg.
* Oversold Conditions in a bear market will not likely result in a strong rally, think of it as "thin ice", no solid foundation.
* Bearish chart patterns will likely execute as expected.
* Bullish chart patterns won't necessarily execute as expected, or if they execute, may not reach upside targets.
So when we bounced off the 200-EMA, I thought of it as thin ice. I'm not expecting a new bull market leg, but rather a bull trap.
Currently price is managing a positive cross above the 20/50-EMAs. That would technically tell me to think about bull market rules, but I'm not convinced we are resuming the bull market. This is purely subjective on my part, but it is based on the behavior of the EMAs on this correction. I'd rather err on the side of bear market rules and think "neutral" out of these oversold conditions of the PMO. I would be far more selective on my buys right now and at this point, I'm mostly in cash until we see a pullback on this rally or a decisive (3%+) breakout above the 50-EMA (reaches 2794). I'll begin thinking bull market rules and think about getting back in at that time, but the current foundation should be looked at as shaky based on bear market bias.
As a side note, if you are a short-term trader, you could use bull/bear market rules but apply them to the 20/50-EMAs instead of the 50/200-EMAs.
While I won't cover them in detail here, bull market rules are below.
Bull Market Rules:
* Oversold Conditions are a buying opportunity
* Overbought Conditions should be considered "neutral" as they can unwind internally even as price consolidates or rises somewhat.
* Bullish chart patterns will likely execute as expected.
* Bearish chart patterns won't necessarily execute as expected, or if they do execute, they may not reach downside targets.
For a detailed explanation of bull/bear market rules, I recommend you check out my 20 minute segment on MarketWatchers LIVE from today's show. You can find it on the StockCharts YouTube channel. Additionally, I've written two articles on this subject which are linked here and here.
Helpful DecisionPoint Links:
DecisionPoint Shared ChartList and DecisionPoint Chart Gallery
Price Momentum Oscillator (PMO)
Swenlin Trading Oscillators (STO-B and STO-V)
Technical Analysis is a windsock, not a crystal ball.
Happy Charting!
- Erin
