 The percentage of stocks above the 50-day EMA is a breadth indicator that measures internal performance. Chartists can compare this indicator across indexes to identify the leaders and laggards. The Nasdaq 100 is the weakest of the major indexes and weighing on the broader market.
The chart below shows %Above 50-day EMA for the S&P 500, S&P Mid-Cap 400, S&P Small-Cap 600 and Nasdaq 100. First, notice that this indicator did not dip below 30% in 2017 for the S&P 500 and Nasdaq 100. This was a strong year for large-caps and large-cap techs.
Breadth weakened considerably 2018 as this indicator dipped below 30% several times for all four indexes. The Nasdaq 100 shows the most internal weakness because the indicator finished the week at 10%, which is by far the lowest reading of the four. Thus, there is broad weakness in the Nasdaq 100. After clearing 70% several times throughout 2017, the S&P 500 indicator did not clear 70% in February-March and fell back below 30% this week.
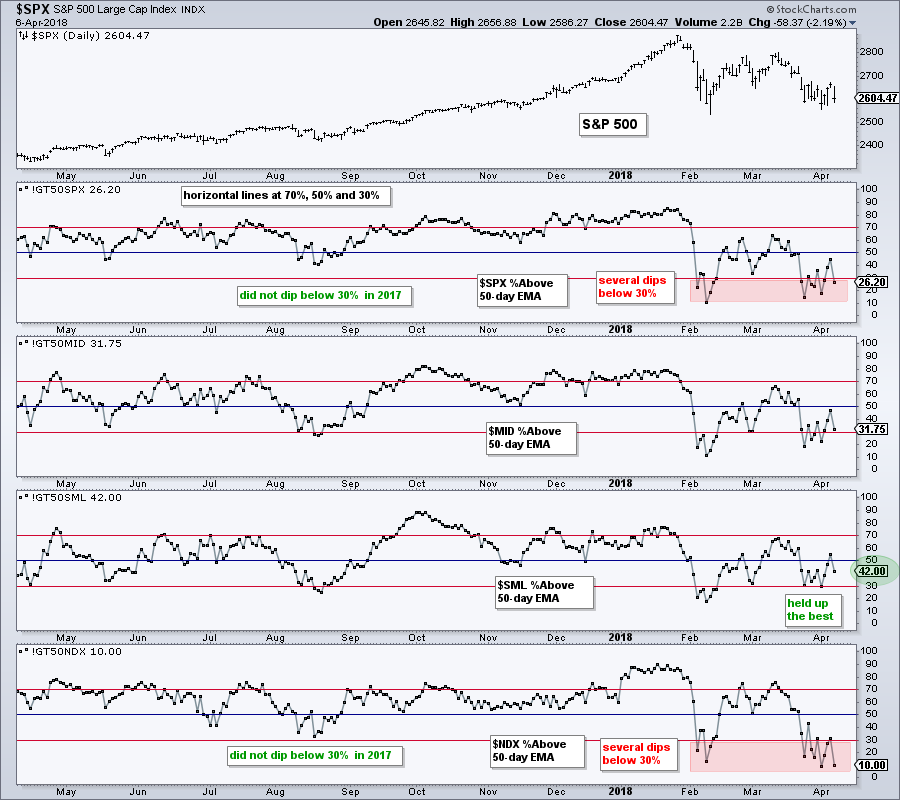
Small-caps are holding up the best. The Small-Cap indicator finished the week at 42% and is the strongest of the four. Also notice that this indicator reached 29.5% on Monday and held up the best of the four.
Some relative strength in small-caps is encouraging, but small-caps are not going to drive the market higher on their own. Relative and absolute weakness in the S&P 500 and the Nasdaq 100 is the problem right now.
Keep in mind that the technology sector accounts for 25% of the S&P 500 and 85 stocks in the Nasdaq 100 are also in the S&P 500. These 85 stocks account for around 37% of the S&p 500. Thus, the Nasdaq 100 is the 800-pound gorilla in the room and the broader market is unlikely to move higher as long as it lags.
Programming Note: My debut on StockCharts TV kicks off this Tuesday at 10:30AM. We will start by testing some key moving averages for the S&P 500.

Plan Your Trade and Trade Your Plan.
- Arthur Hill, CMT
Senior Technical Analyst, StockCharts.com
Book: Define the Trend and Trade the Trend
Twitter: Follow @ArthurHill


