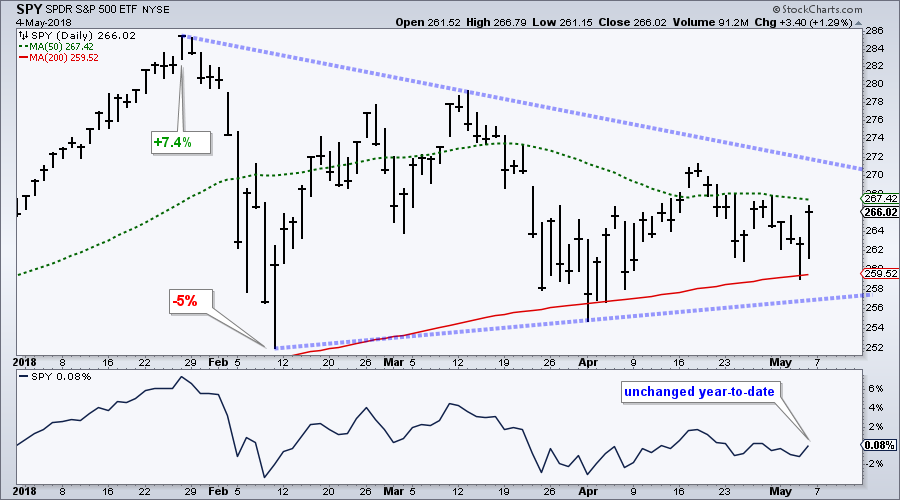
 2018 has been a tough year for stocks with the S&P 500 SPDR (SPY) basically unchanged (+.08%) for the year. During this journey to unchanged, SPY was up around 7% at its late January high and down around 5% at its February low. The index has since gyrated within the range set from this high and low.
The chart below shows this year's price action with a large triangle taking shape as the range narrows. The overall trend is still up because the 50-day SMA is above the 200-day SMA, the 200-day SMA is rising and price is still above the 200-day SMA.
2018 looks like one volatile mess on its way to nowhere when viewed close up. Things change, however, when we take the bird's eye view to gain some perspective.
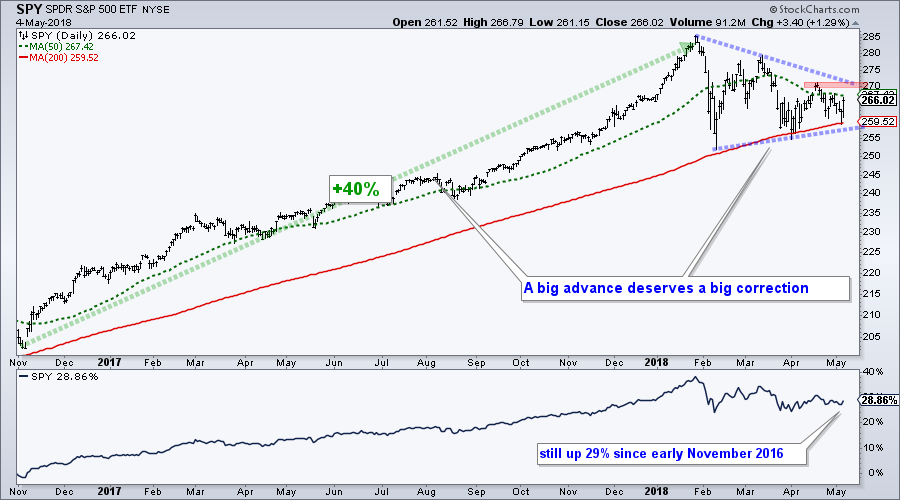
The next chart shows SPY from early November 2016 to early May 2018. The triangle is still there, but it looks less daunting when matched against the prior advance. Notice that SPY was up some 40% from early November 2016 to late January 2018. This monster advance deserves a complementary correction, not just a one to two week pullback.
When paired with the prior advance, this triangle looks like a consolidation within a bigger uptrend. In other words, it is a rest after a massive advance. The market is digesting the gains of the prior 15 months and building energy for the next move. The upper line of the triangle and April high mark resistance. A breakout here would resolve this pattern to the upside and project a move to new highs.
Plan Your Trade and Trade Your Plan.
- Arthur Hill, CMT
Senior Technical Analyst, StockCharts.com
Book: Define the Trend and Trade the Trend
Twitter: Follow @ArthurHill


