Editor's Note: This article was originally published in Martin Pring's Market Roundup on Wednesday, April 24th at 7:03pm ET.
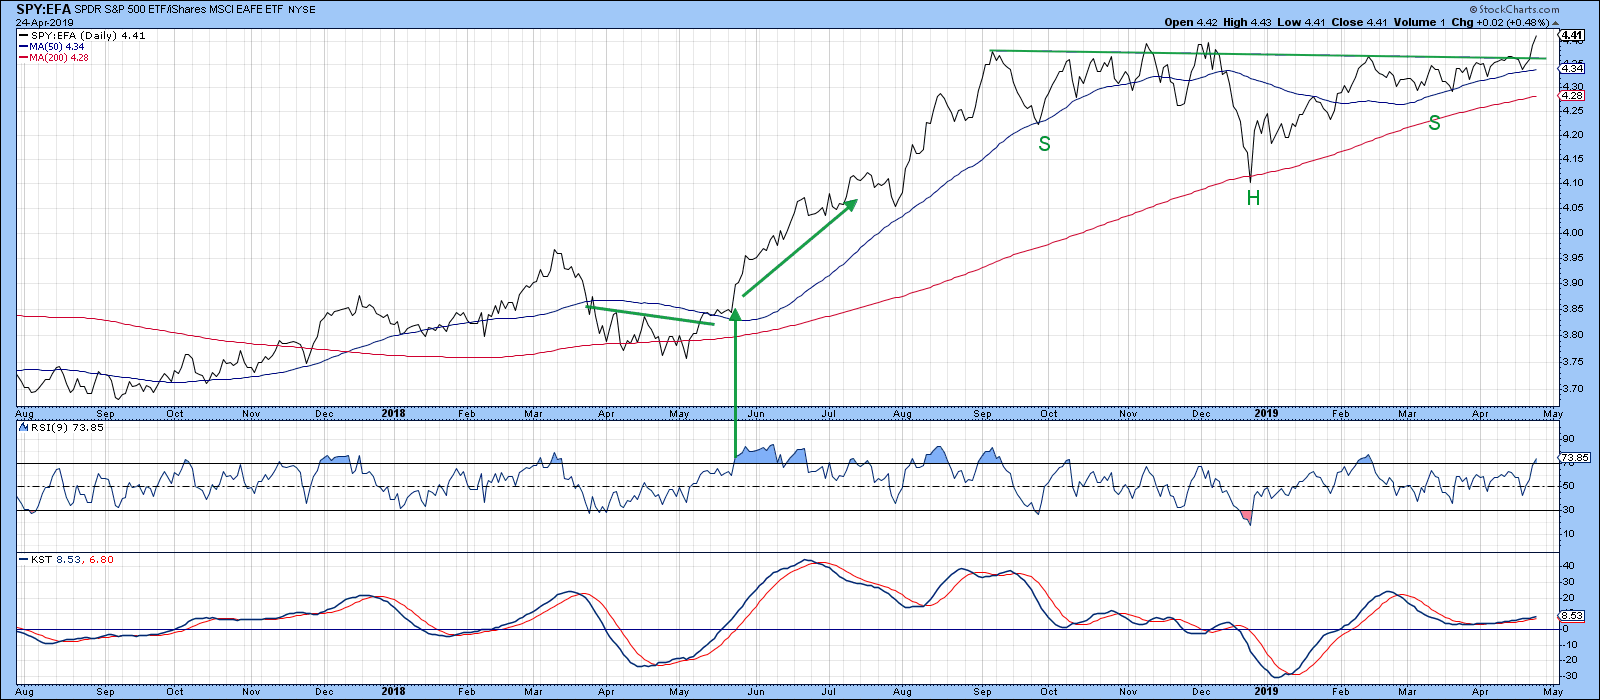
Yesterday’s all-time new high in the S&P was well documented by the media, but what did not receive any attention was the fact that the SPY also reached a new high-water mark relative to the MSCI Europe Australia Far East ETF, a.k.a. the rest of the world. You can see that from Chart 1, where the ratio has broken out from a consolidation reverse head-and-shoulders. The RSI looks a little overstretched, but that does not necessarily translate into weakness, as you can see from the two green arrows following the 2018 breakout. In any event, the daily KST has just gone bullish and is by no means overbought.
 Chart 1
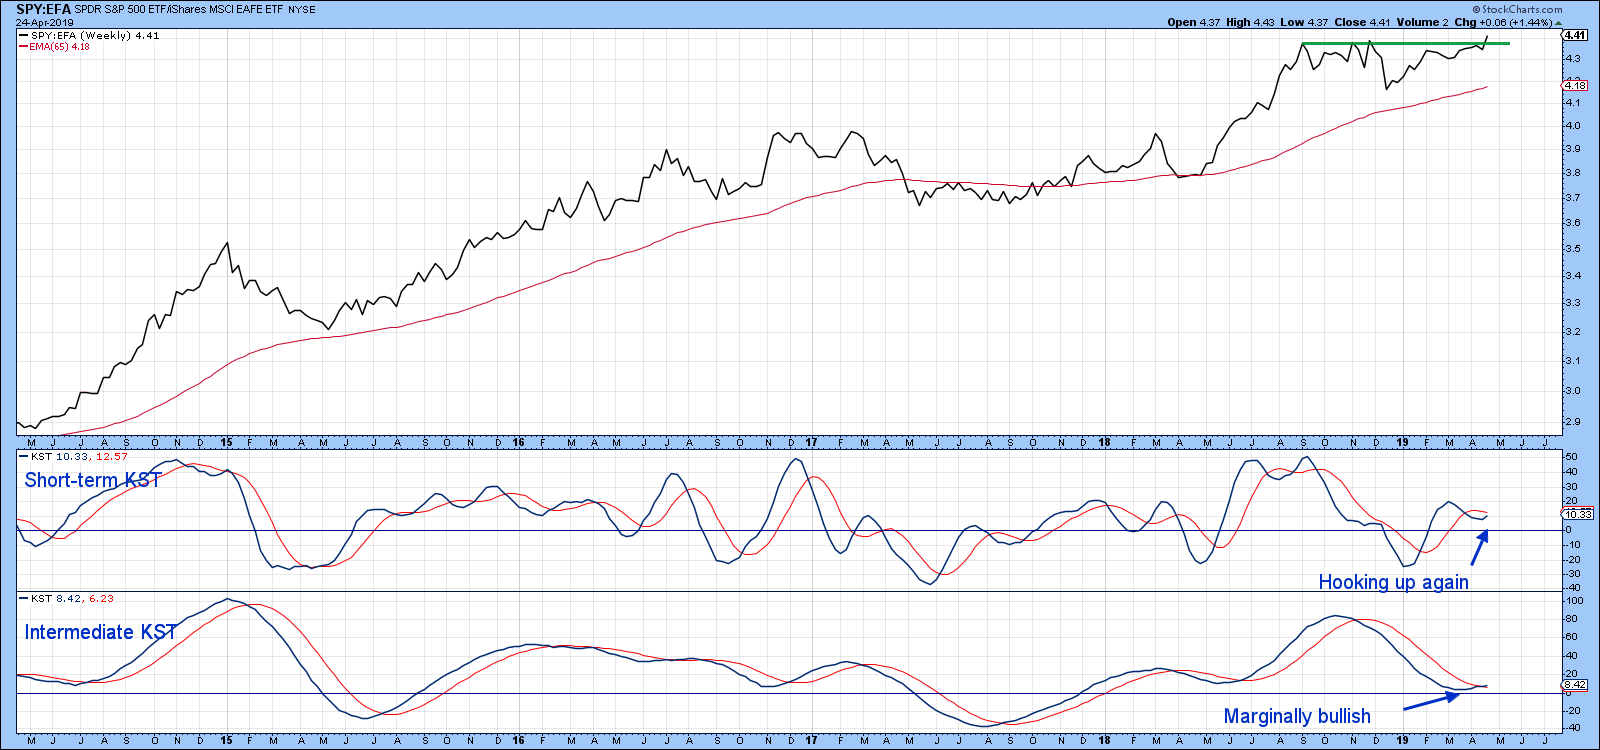
Chart 2 shows that the short-term KST, calculated from weekly data, has just started to turn up again. However, it is not officially bullish, as it has yet to cross above its EMA. The slower-moving intermediate series, though, has experienced a marginal buy signal. The obvious investment implication from this breakout is for a continued superior performance by the US and a general downplaying of international exposure. Chart 2
Good luck and good charting,
Martin J. Pring
The views expressed in this article are those of the author and do not necessarily reflect the position or opinion of Pring Turner Capital Group of Walnut Creek or its affiliates.


