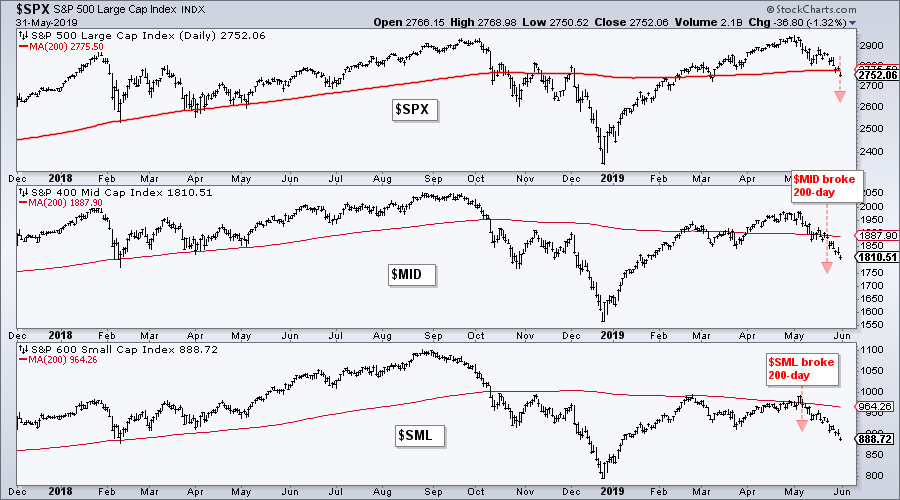
 The 200-day moving averages for the S&P Mid-Cap 400 and the S&P Small-Cap 600 are already trending lower and this key moving average for the S&P 500 turned lower over the past week. This puts all three indexes below their falling 200-day SMAs and in potential downtrends.
Chartists can use moving averages to determine the trend in at least two ways. First, the trend is up when price is above the moving average and down when price is below the moving average. The chart below shows $SML breaking its 200-day SMA on May 7th. $MID followed suit with a move below on May 22nd and $SPX closed below the 200-day on May 31st.
 Chartists can also use the direction of the moving average to determine trend. A rising moving average indicates an uptrend, while a falling moving average signals a downtrend. Moving average direction is not always easy to determine. Sometimes we need to remove the price bars and shorten the timeframe to see more detail. The chart below focuses on the moving averages by making the price bars invisible. Click the chart to open it and see the SharpChart settings.
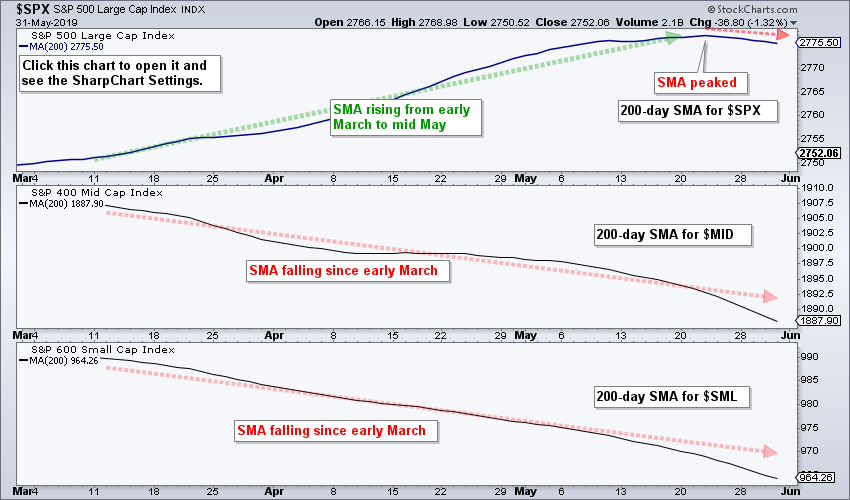 Notice that the 200-day SMAs for the S&P Mid-Cap 400 and S&P Small-Cap 600 have been falling since March and continued their fall in May. In contrast, the 200-day SMA for the S&P 500 rose from March to mid May and then turned lower over the last five days. With the SMA for the S&P 500 turning lower, all three indexes are now below their falling 200-day SMAs and in long-term downtrends.
On Trend on Youtube (Thursday, 30-May)
- SPY: Oversold at 200-day SMA
- New Lows Expand (Indexes and Sectors)
- Several Semis are Oversold at Support
- A New Play on Palladium?
- Click here to Watch.
On Trend on Youtube (Tuesday, 28-May)
- Walking Down the Lower Bollinger Band
- Sectors Above/Below 200-Day SMA
- Focus on XLV and Healthcare Stocks
- Breakdowns in Industrial and Discretionary Stocks
- FAAAM+: FB, AMZN, AAPL, GOOGL, MSFT (+NFLX).
- Click here to Watch
Arthur Hill, CMT
Senior Technical Analyst, StockCharts.com
Author, Define the Trend and Trade the Trend
Want to stay up to date with the latest market insights from Arthur?
– Follow @ArthurHill on Twitter
– Subscribe to Art's Charts
– Watch On Trend on StockCharts TV (Tuesdays / Thursdays at 10:30am ET)


