 Many a pundit considers small-caps as the canaries in the coal mine and this implies that relative weakness in small-caps is negative for the broader market. As Missanei of Game of Thrones might say: It is known. Known, yes, but is it actually true?
In the interest of full disclosure, I bought into the argument that small-caps were the canaries in the coal mine and relative weakness was negative for the broader market. It certainly makes sense, but the markets often march to the beat of a nonsensical drummer.
We can certainly eye-ball charts and find instances when relative weakness in small-caps provided a bearish omen for the broader market. We can also find instances when relative weakness in small-caps did not matter. The only way to truly know is to quantify performance and test over an extended timeframe. Here we go....
The first chart shows the Russell 2000 relative to the S&P 500 ($RUT:$SPX ratio) in the top window. This ratio rises when the Russell 2000 outperforms, which also means the S&P 500 is underperforming. The ratio falls when the Russell 2000 underperforms, which also means the S&P 500 is outperforming. Note that the Russell 2000 underperformed the S&P 500 from 1995 to 1999, outperformed from 1999 until 2006 and performed in line with the S&P 500 over the last 14 years. Of course, there were bouts of outperformance and underperformance within this flat stretch.
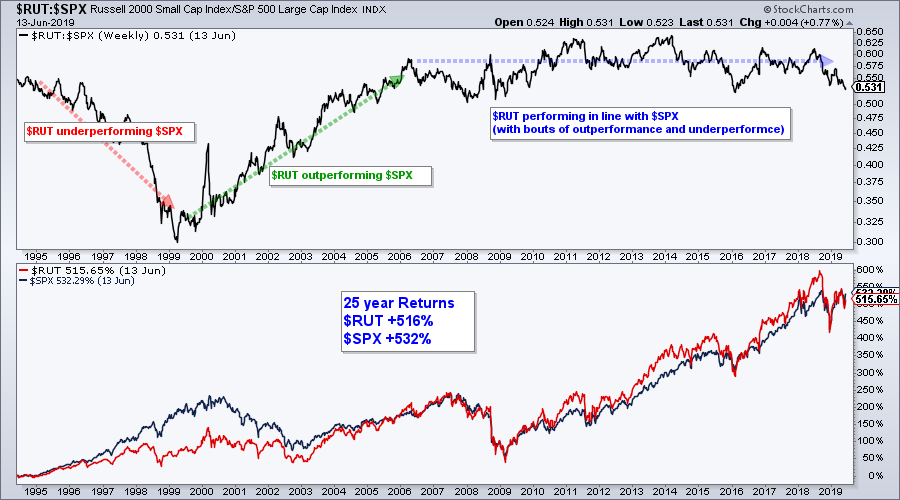
The 25-year performance in the bottom window is most telling. The Russell 2000 was up around 600% in August 2018 and outperforming the S&P 500, but gave some back and is now underperforming. As of June 13th, the Russell 2000 was up 516% over the last 25 years and the S&P 500 was up 532%. Yes, the S&P 500 has outperformed the Russell 2000. Frankly, I find it pretty amazing that the S&P 500 has more than held its own throughout this 25 year period.
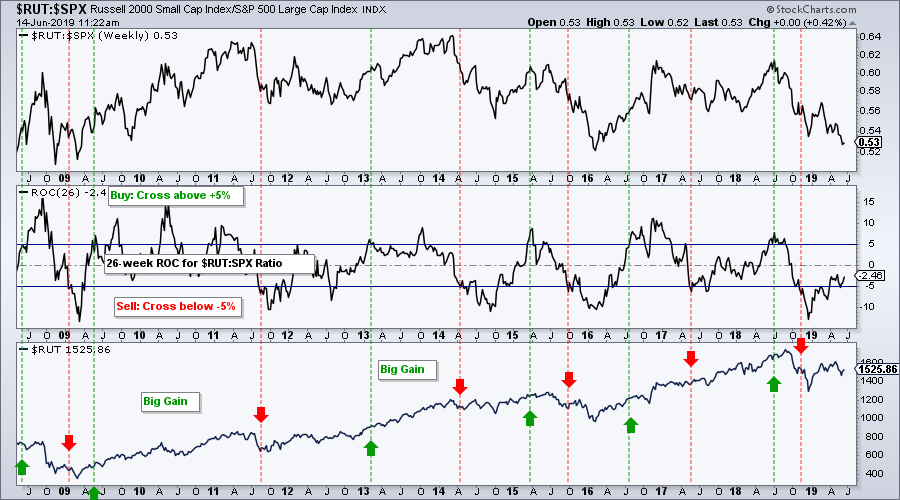
We can quantify periods of relative strength and relative weakness using the Rate-of-Change (ROC) of the $RUT:$SPX ratio. In particular, the Russell 2000 is clearly outperforming when the 26-week ROC of $RUT:$SPX exceeds +5% and underperforming when the 26-week ROC of $RUT:$SPX exceeds -5%. The chart below shows this indicator in the lower window with bullish signals in green (cross above +5%) and bearish signals in red (cross below -5%).
To test these signals, the strategy buys the Russell 2000 when it outperforms (ROC cross above +5%) and sells when it underperforms (ROC cross below -5%). The chart above shows 11 years and this is not enough for a backtest because there were not any extended bear markets. Instead, I decided to run this test over a 25 year period and the results are shown in the table below. The first line with gray shading shows results when buying $RUT outperformance and selling $RUT underperformance, while the second line shows the opposite (buying $RUT underperformance and selling $RUT outperformance).
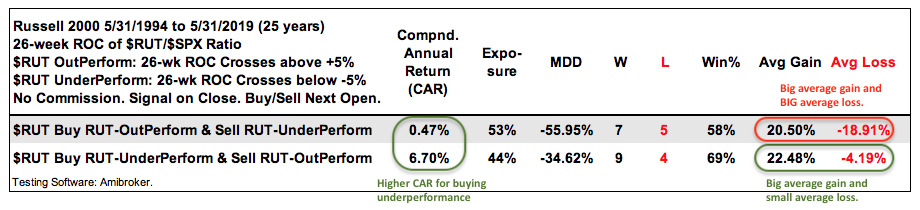 As the results show, buying the Russell 2000 when it showed strong outperformance did not work out well over the last 25 years. This is hardly surprising when we consider the first chart in this article. There were seven winning trades and five losing trades. The average gain was 20.5%, which is good, but the average loss was high too (18.91%).
In contrast, buying the Russell 2000 when it was underperforming worked much better. The Compound Annual Return was 6.7% with nine winners and four losers. The average gain was 22.5% and the average loss was just 4.2%. This means it is better to buy the Russell 2000 when it is underperforming the S&P 500. Put another way, buy $RUT when the S&P 500 is leading.
Note that I also tested a moving average crossover strategy and the results were similar. Buy when the 10-week SMA of the $RUT:$SPX ratio crosses above the 40-week (outperforming) and sell when the 10-week crosses below the 40-week (underperforming). Again one would have been better off buying when the 10-week SMA moved BELOW the 40-week SMA and selling when the 10-week moved above the 40-week.
Traders are better off buying the Russell 2000 when the S&P 500 is outperforming. This suggests that the S&P 500 is the main driver for stock prices, small and large. Small-caps are not the canary in the coal mine because the S&P 500 is the 800-pound gorilla in the market. If anything, chartists should become concerned when the S&P 500 starts lagging the Russell 2000. While past performance does not guarantee future performance, the last 25 years suggest that we at least need a rethink when it comes to interpreting relative weakness in small-caps.
And just to take this one step further, what if we trade $SPX instead of $RUT? The next table shows the same trades, but buying the S&P 500 when the Russell 2000 underperforms and selling when the Russell 2000 outperforms. As with the table above, the best results are to buy the S&P 500 when the Russell 2000 underpeforms and sell when $RUT outperforms (CAR 6.97%, Wins 10, Losses 3, Avg Gain 20.13%, Avg Loss (3.82%). This is basically buying when $SPX outperforms and selling when $SPX underperforms.
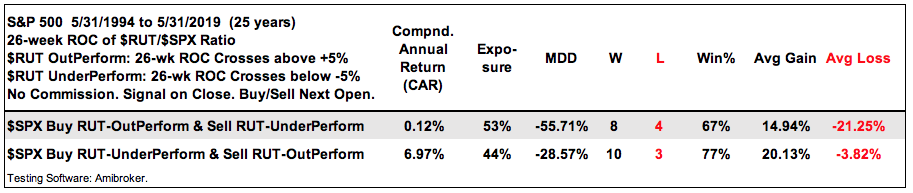
Clearly, the S&P 500 is the key driver for stocks and stocks perform best when large-caps lead. The Russell 2000 is just along for the ride.
On Trend on YouTube (Thursday, June 13th)
- SPY, QQQ and IWM Hold Breakouts
- Biotech ETFs Hit Reversal Zones
- Chinese ETFs Diverge as ASHR Outperforms
- "On Trend" Stocks to Watch
- Click here to Watch
Arthur Hill, CMT
Senior Technical Analyst, StockCharts.com
Author, Define the Trend and Trade the Trend
Want to stay up to date with the latest market insights from Arthur?
– Follow @ArthurHill on Twitter
– Subscribe to Art's Charts
– Watch On Trend on StockCharts TV (Tuesdays / Thursdays at 10:30am ET)


