Editor's Note: This article was originally published in Martin Pring's Market Roundup on Tuesday, July 2nd at 12:36pm ET.
Back in May, I wrote an article entitled “Commodities: Down Now, Up Later?" in which I pointed out some of the long-term technical bullish potential for the commodity markets, as well as some of the near-term vulnerabilities. The thought was that prices would experience some near-term weakness, after which some of these bullish factors could come into play. As it turned out, the CRB Composite dropped about 10 points and subsequently regained 8 of them. As Chart 1 shows, all that has happened in the meantime is an extension of the 2016-19 trading range.
If the Index drops below its late 2018 monthly closing low of 170, that will complete a consolidation bearish head and shoulders. On the other hand, a close greater than 189 will place it above its 12- and 24-month MAs, as well as the 2008-19 secular downtrend line. Such action would likely push that 18-month ROC above its secular downtrend line as well. In many cases when an oscillator, such as this, cracks a very long-term momentum indicator, it flags a major trend reversal. That secular line also joins the head with the right shoulder of that potential head and shoulders. Since the top of that shoulder is below 189, that would be additional evidence pointing to its bearish demise. I must stress that none of this bullish action has yet taken place and price is still locked in that trading range, so let’s not jump the gun in either direction.
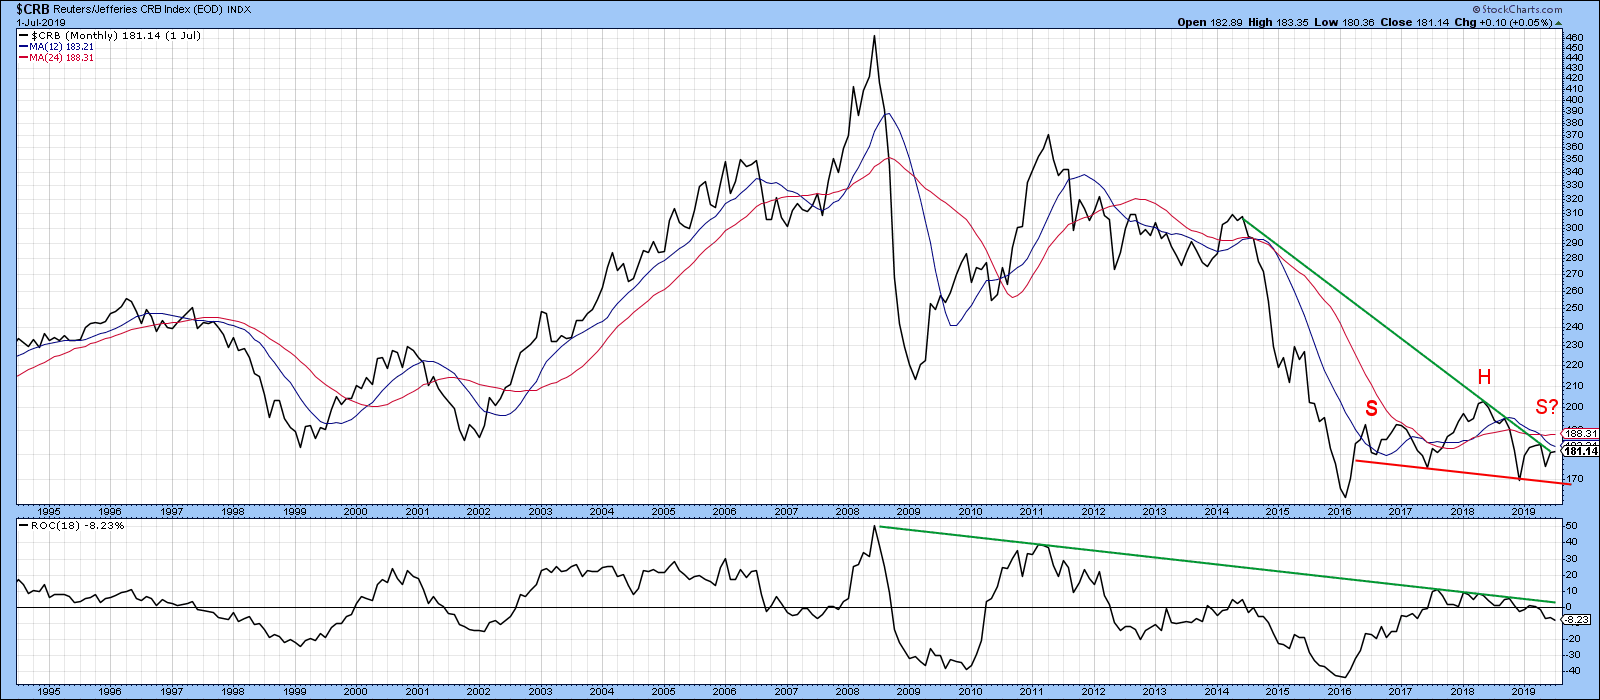 Chart 1
Indeed, Chart 2 indicates that the 50-day net new high commodity oscillator has started to decline from an overbought condition. The red arrows point up similar situations and, in most instances, we saw a 1-to-2-week decline. Since the Index is also running into its green resistance trend line and the 200-day MA, a test of the all-important 2016-19 uptrend line cannot be ruled out.
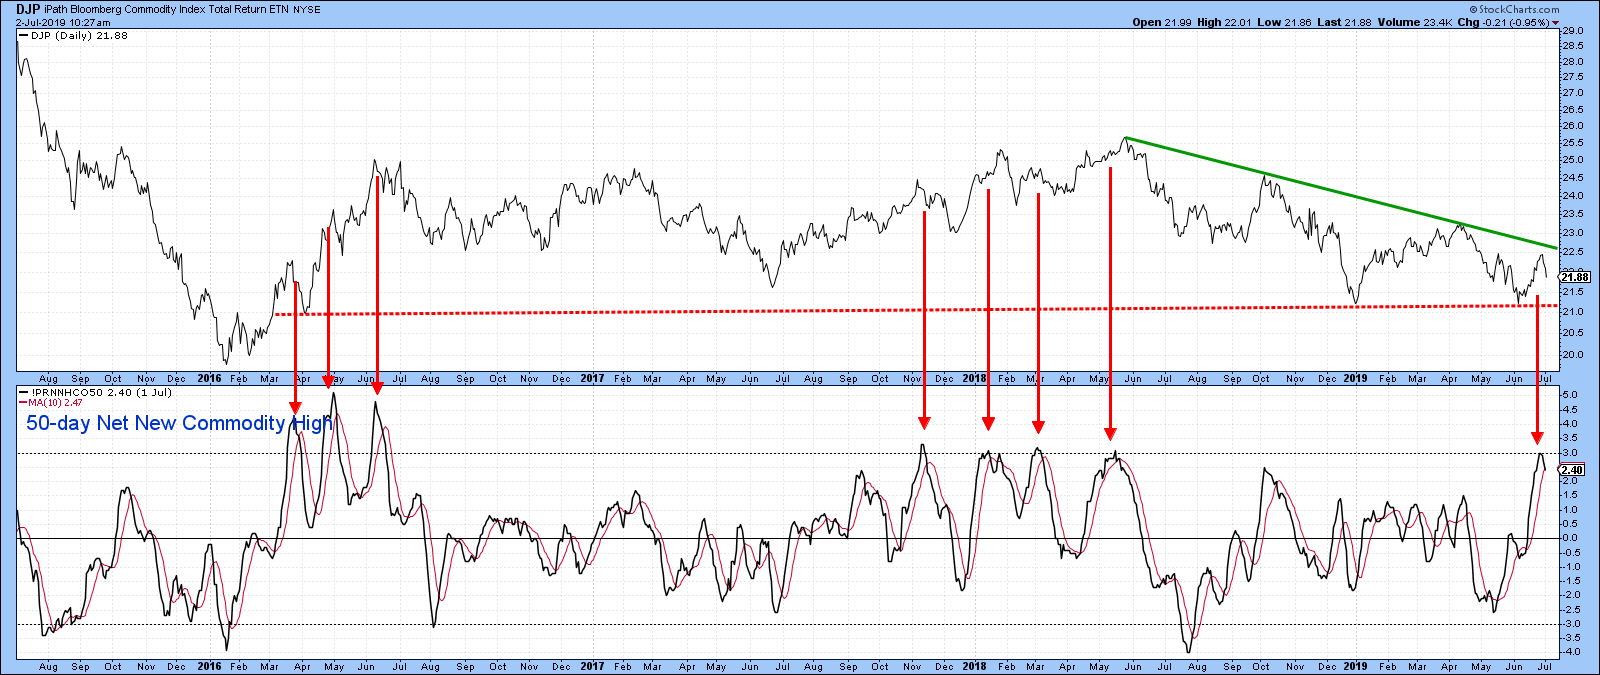 Chart 2
Good luck and good charting,
Martin J. Pring
The views expressed in this article are those of the author and do not necessarily reflect the position or opinion of Pring Turner Capital Group of Walnut Creek or its affiliates.
