 A short, but strong, trading session just before the Fourth of July holiday pushed the S&P, along with the Nasdaq 100 and the DJ Industrials indexes, to new highs.
Breaks to new highs are pretty strong signs and should not be ignored. At the end of the day, it's hard to be bearish when a market makes new highs.
As I write this, daytime in Amsterdam on Friday, 5 July, the weekly close for these indexes in the US is not yet available. European markets are unchanged and probably waiting for guidance from the US.
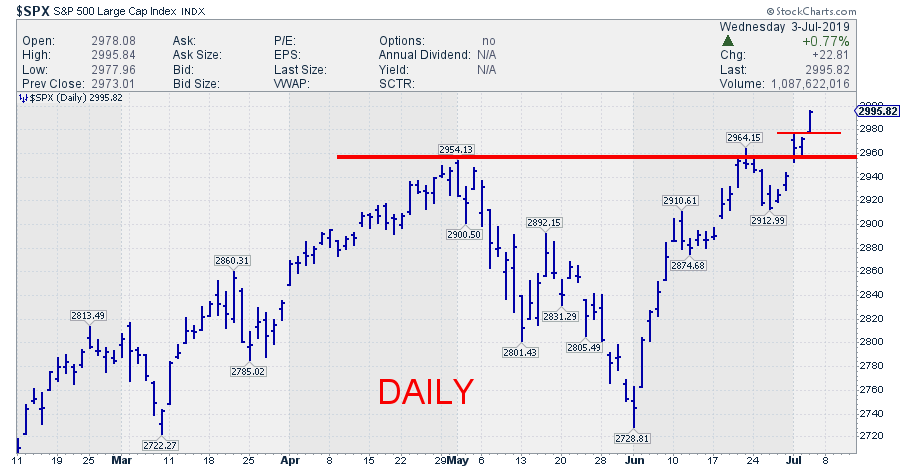
On the daily chart below, the break is clearly visible.
 If we manage to hold above 2955 at Friday's close, that break will also be confirmed on the weekly chart, making it even more important. However, that's not a done deal yet; today is an important day, with payrolls and unemployment data still to be released.
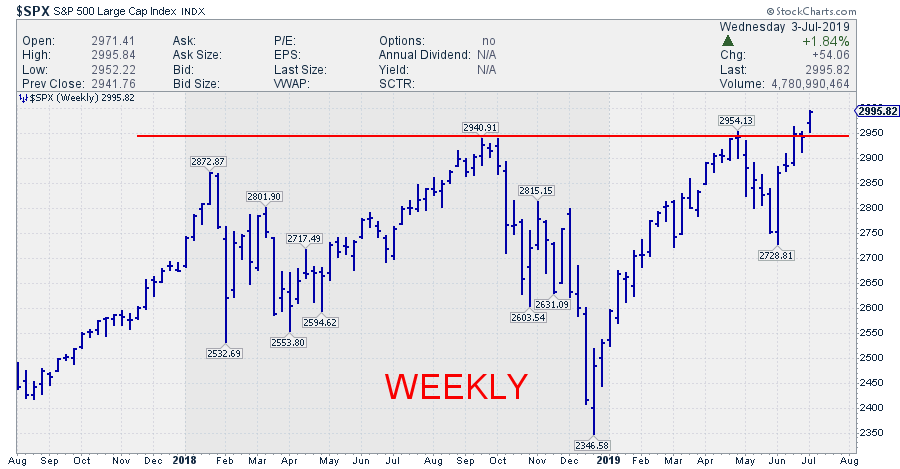
That weekly chart also reveals that this break, in essence, means a break from an 18-month consolidation, which is all-in-all pretty bullish.
Pockets Of Concern
Does all this mean that all stars are aligned for another continuation of the blistering bull-market? I am not sure. But I do still see some pockets of concern.
1. Asset Class Rotation Starting To Favor Bonds (And Real Estate)
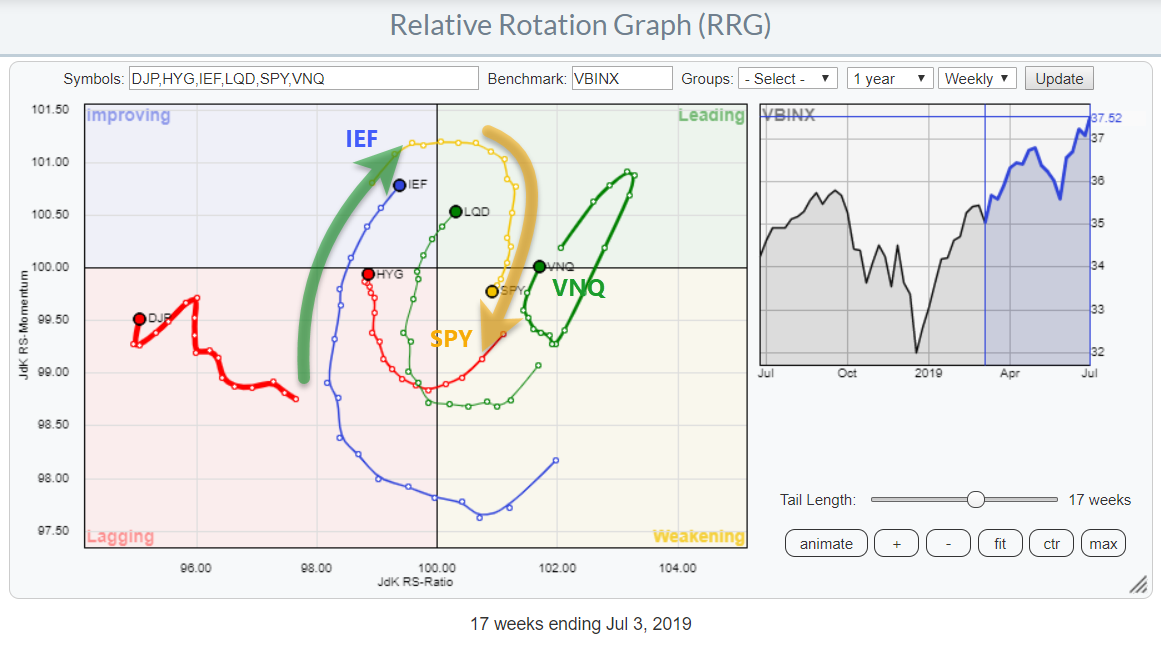 My first observation comes from the above Relative Rotation Graph, which tracks the rotation for various asset classes. The recent rotation is clearly in favor of bonds over stocks, with the tail for IEF traveling through the improving quadrant at a strong RRG-Heading and close to crossing over to leading. SPY, meanwhile just moved inside the weakening quadrant and is at a negative RRG-Heading.
A rotation favoring SPY would be much more supportive for a broad-based (continuation of the) stock market rally. We'll have to see if the strength in stocks will be enough to drag the tail on SPY back up towards (and into) leading.
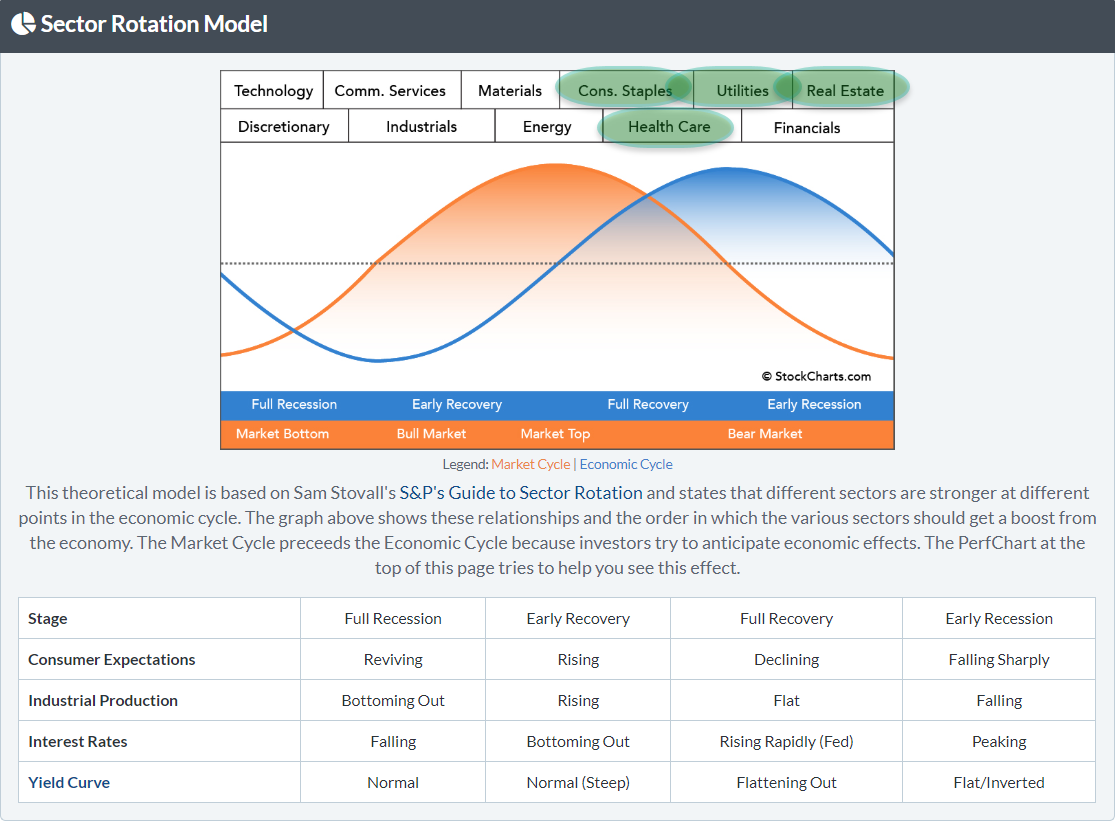
2. Stocks Rotate To Defensive Sectors
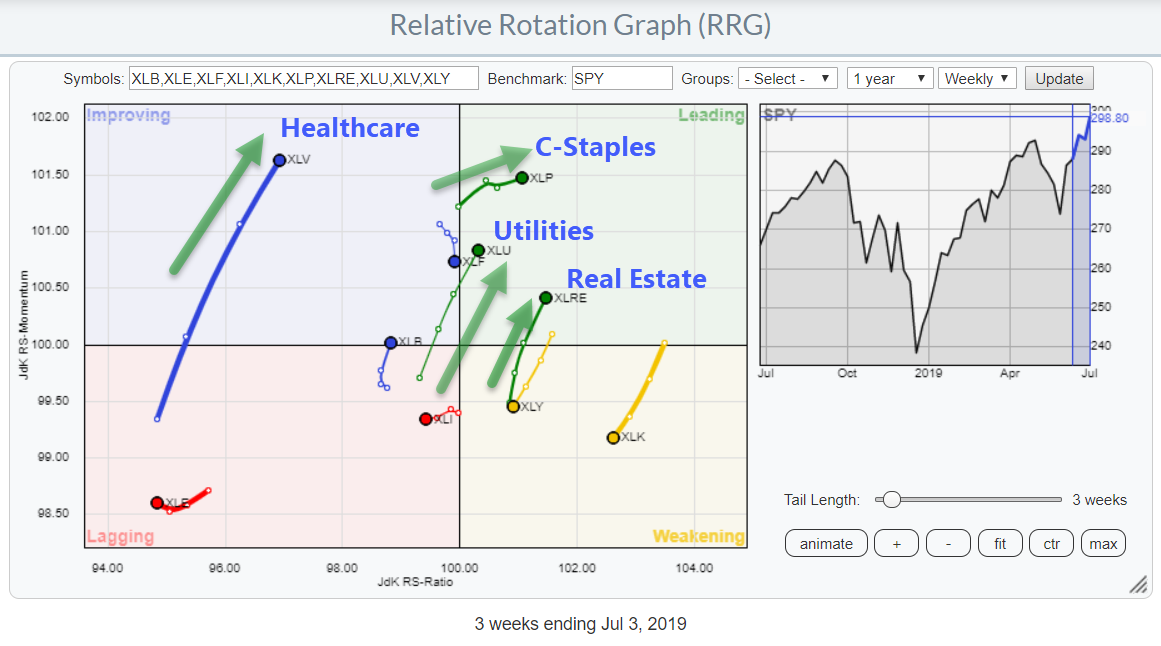 The second pocket of concern is the very clear rotation to sectors that are generally considered to be "defensive."
The ultimate defensive sectors, Consumer Staples and Utilities, are already well inside the leading quadrant and pushing further into it, together with the Real Estate sector that just returned into the leading quadrant following a corrective rotation through weakening.
Inside the improving quadrant, the Healthcare sector definitely stands out, with a long tail at a strong RRG-Heading.
When I map these relative trends onto the sector rotation model, they line up with a market that is at a market top (end of expansion cycle).
3. Value Starting To Pick-Up vs. Growth
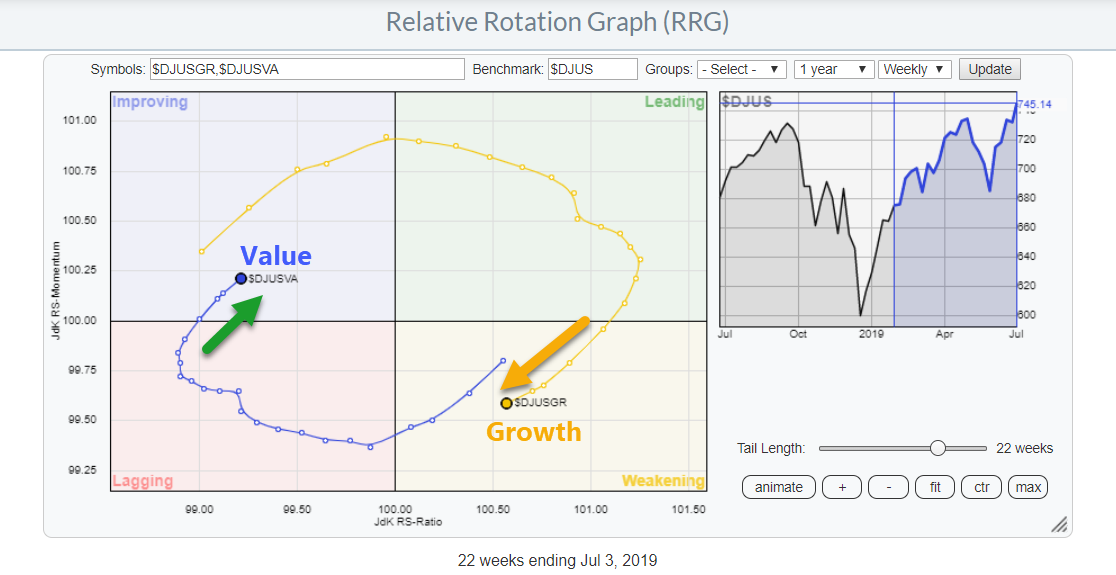
In general, this relationship is in favor of Growth stocks when markets go up (strongly) and in favor of Value when markets flatten out or go down. In other words, Value is the defensive play while Growth is the offensive play.
The third pocket of concern is the observation on the rotational picture that the tails on the RRG above have recently started to move in favor of Value over Growth, albeit with Value inside the improving quadrant and Growth inside weakening.
The accompanying line-chart of this relationship shows that $DJUSGR:$DJUSVA is pushing against resistance.
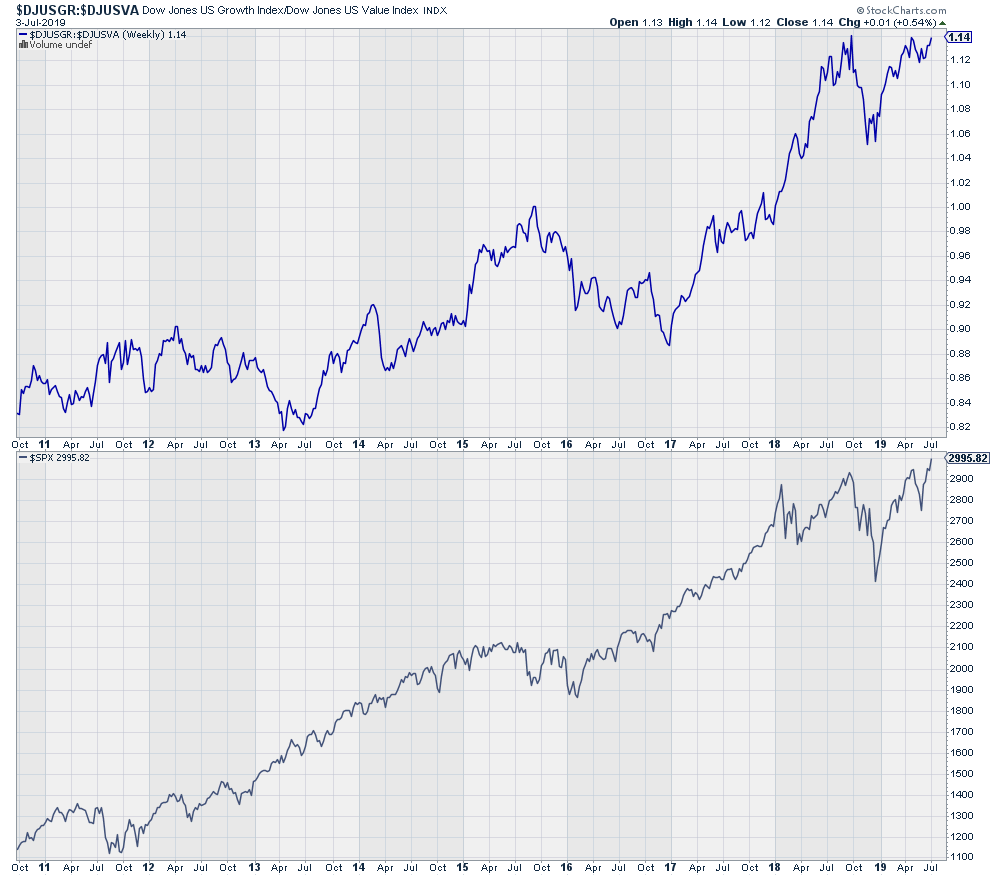 As long as this ratio remains below overhead resistance, that pocket of concern remains intact. Once this hurdle is taken out, especially if this happens soon (i.e. in the coming weeks), the rotations for Value and Growth may complete at their current sides of the RRG, lifting this potential drag for the market.
Price Is Leading
As always, price is leading and the $SPX broke higher. That's a given, and it is good. However, despite this positive development, there are enough weak spots in the overall picture to warrant a bit of extra caution and maybe some close(r) monitoring of positions than normal for a blistering bull-market.
My regular blog is the RRG Charts blog. If you would like to receive a notification when a new article is published, simply Subscribe using your email address.
Julius de Kempenaer
Senior Technical Analyst, StockCharts.com
Creator, Relative Rotation Graphs
Founder, RRG Research
Want to stay up to date with the latest market insights from Julius?
– Follow @RRGResearch on Twitter
– Like RRG Research on Facebook
– Follow RRG Research on LinkedIn
– Subscribe to the RRG Charts blog on StockCharts
Feedback, comments or questions are welcome at Juliusdk@stockcharts.com. I cannot promise to respond to each and every message, but I will certainly read them and, where reasonably possible, use the feedback and comments or answer questions.
To discuss RRG with me on S.C.A.N., tag me using the handle Julius_RRG.
RRG, Relative Rotation Graphs, JdK RS-Ratio, and JdK RS-Momentum are registered trademarks of RRG Research.


