
The S&P 500 hit a new high in late July and then got pummeled in early August with a sharp decline that broke the 50-day EMA. Moving averages like this can serve benchmark levels that chartists can use to compare performance. Stocks and ETFs that did not break their 50-day EMAs showed relative strength and warrant our attention. Stocks and ETFs that broke their 50-day EMAs did not hold up as well.
------------------------------------------------------------
State of the Markets Video
Recorded Saturday, August 10th: Watch on YouTube (click here)
------------------------------------------------------------
Let's start with some basic analysis of the S&P 500, which serves as my benchmark for the US stock market. The index hit a new high in July and then fell around 6% with a sharp decline. At this stage, the index remains above the early June low and above the 200-day SMA, which turned up over the last few weeks. Even with the August dive, the long-term uptrend was never in question.
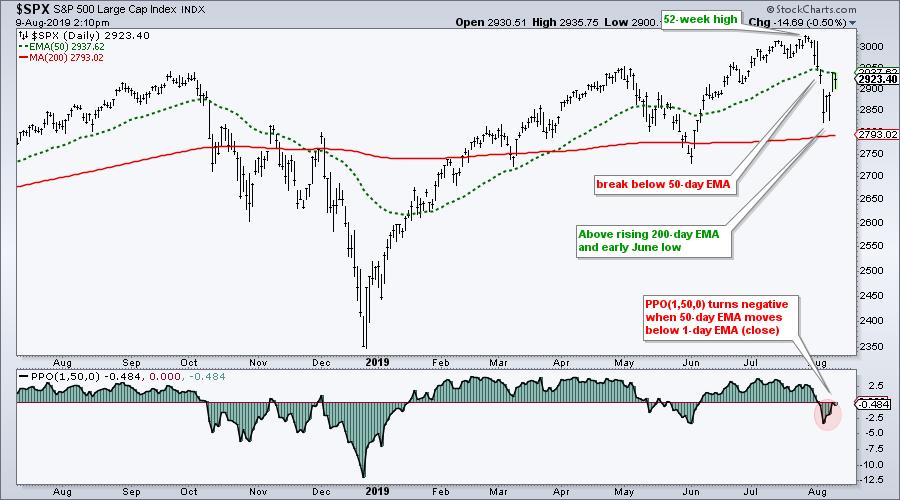
The indicator window shows the Percentage Price Oscillator (1,50,0) dipping below zero, which means the index closed below the 50-day EMA. The PPO is based on an exponential moving average and this is why I am using a 50-day EMA on the price chart, as opposed to an SMA.
I ran a scan on Thursday looking for S&P 500 stocks that are in long-term uptrends (above 200-day SMA) and that held up well in early August (PPO(1,50,0) did not dip below zero over the last five days). The scan code is simple, and shown below:
[group is SP500] and [Min(5,PPO Line(1,50,0)) > 0 ] and [Close > SMA(200,Close)]
In particular, I was interested in the sectors with the strongest stocks. I then counted the number of stocks in each sector that met the scan criteria and divided by the total number of stocks in each sector. This is an important step because some sectors have more stocks than other sectors. Consumer Discretionary, Financials, Technology, Industrials and Health Care have more than 60 stocks each, but Communication Services, Energy, Materials and Utilities have less than 30 stocks each. The table below shows the results.
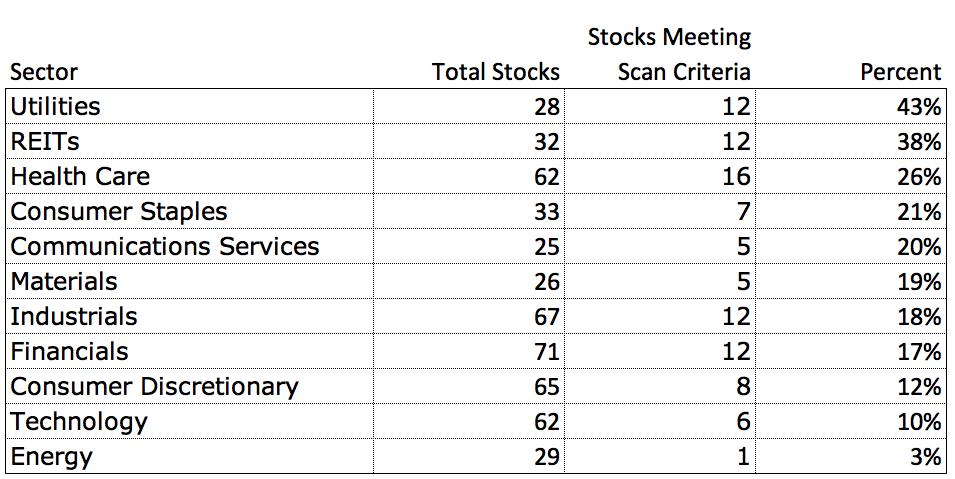
Overall, Utilities and REITs held up the best during the August plunge. Healthcare also put in a respectable performance with 26% of its components holding above the 50-day EMA last week (and above the 200-day SMA). For individual names, I am seeing strength in Twitter (TWTR), DR Horton (DHI), Merck (MRK), Stryker (SYK), Lockheed Martin (LMT), Sealed Air (SEE) and Packaging Corp of America (PKG).
Check out Art's Charts for the Friday's State of the Stock Market Report and Saturday video. No subscription required. Click here.
------------------------------------------------------------
Choose a Strategy, Develop a Plan and Follow a Process
Arthur Hill, CMT
Chief Technical Strategist, TrendInvestorPro.com
Author, Define the Trend and Trade the Trend
Want to stay up to date with Arthur's latest market insights?
– Follow @ArthurHill on Twitter
