(This is a reprint of a Trading Places blog article written a week ago. I've updated the performance and charts to include last week's selloff.)
Beating the S&P 500 is my #1 goal. If I didn't believe I could beat the S&P 500, I'd simply buy the SPY (ETF that tracks the S&P 500) and call it a day. But I know I can beat the S&P 500 performance, and you can too. Beginning in November 2018, I created my Model Portfolio. In May 2019, I added two additional portfolios, my Aggressive Portfolio and Income Portfolio. All three consist of 10 equal-weighted stocks that have two common characteristics - strong earnings and relative strength. Fundamentals combined with technicals is the absolute best approach to trading the stock market, without a doubt. It's not gambling - it's doing your homework.
The Big Picture
I take a top-down approach that starts with my overall view of the stock market. I am very bullish, much more so than most, and I believe we remain in the relatively early stages of a secular bull market. That doesn't mean we will go up every day; in fact, from time to time, we'll have cyclical bear markets. These will be much different than the secular bear markets we endured in 2000-2002 and 2007-2009, however. They'll be quick, scary and probably cause quite a bit of portfolio pain. Think back to Q4 2018. That's the type of cyclical bear market I'm talking about.
How can I be so bullish with all the worries out there? Well, first of all, we always have worries if that's what you choose to focus on. Instead, I'll focus on the historically low interest rates, which are very business-friendly. We certainly can't ignore central bankers that are dovish across the globe. Finally, we haven't even scratched the surface of rotation from defensive treasuries to aggressive equities. Trillions of dollars have poured into U.S. and foreign treasuries to drive yields to record or near-record lows. When treasury holders start selling, where do you think those proceeds will go? Global equities. It's coming. It's a matter of timing. We're nowhere near a euphoric bull market high. It's quite the opposite actually, as we are slowly climbing that "wall of worry." When much stronger economic news hits, massive amounts of capital will shift to equities, in addition to a lot of new money. Smart money is already positioning for it as aggressive sectors led the charge to all-time highs. It's happening one step at a time as everyone frets the small stuff. Turn off CNBC and turn on StockCharts.com, EarningsBeats.com, my Trading Places blog and my fellow technical analysts here.
Keys To A Strong Portfolio
Solid earnings. Relative strength. Wall Street accumulation.
If you get those three on your side, you've got a great chance for success. Those are my 3 pillars. Because I'm a CPA, I honestly must trust management. If a company says, "we missed our prior estimates, but next quarter or next year we'll do better," why should I believe them? They literally just failed on their last promise and now I'm supposed to believe their next one? Really? I want a management team that executes and is conservative with their guidance. It reduces the chances of a warning that devastates portfolios. Beat your revenue estimate. Beat your earnings per share (EPS) estimate. Convince Wall Street that you're worthy of their investment dollars. Then, and only then, will I consider investing my dollars in your company. It's really quite simple and disciplined, and I stick to it religiously in my portfolios.
So let's move on to my portfolios and their respective highlights and goals. Before I go into individual portfolio specifics, here are common traits of each portfolio:
(1) Each portfolio contains 10 stocks from 10 different industry groups. I do not attempt to cover all sectors. After all, if a sector is underperforming, why do I want to own it? I'm not a value investor. I trade relative strength, not falling knives.
(2) Every stock has beaten Wall Street consensus estimates as to both revenues and EPS in its latest quarterly report. Every. Single. One. No exceptions!
(3) Every stock is technically sound (in my opinion).
(4) Every stock is held an entire quarter. This means you will hold every stock through one earnings report. This one is really hard for me, but by holding 10 stocks through earnings reports, the idea is that the great earnings reports will more than offset the poor reports.
(5) Every stock is selected as of the 19th day of February, May, August and November. The reason for this timing is to allow the time for every stock to report its quarterly results and for me to analyze those reports and Wall Street's reaction to those reports. That last part - Wall Street's reaction - is very important. I might think a particular earnings report is very solid and want to buy it immediately. However, many times, a company reports stellar results but then trades down on both an absolute and relative basis after the report. I need to see that to make an informed decision. So I wait... until the 19th. It's just a date that I've picked. I guess it could have been the 16th, the 21st, whatever. But I've gone with the 19th. It's my OCD kicking in, I suppose. :-)
Now, the specific portfolios:
Model Portfolio
Let me explain how the concept of these portfolios came about. Since Q4 2013, I've traded almost exclusively from my Strong Earnings ChartList (SECL) that I keep here at StockCharts.com. I review thousands of earnings reports every quarter and quickly narrow the list down to only those companies that beat revenue and EPS estimates. Then, they must meet certain volume requirements, as I won't trade illiquid stocks. At that point, I look at the absolute and relative charts. If they've had clear positive reactions after posting better-than-expected earnings and they're liquid, I add them to my SECL. Usually, if I think they're borderline in terms of their technical outlook or if their industry group is weak, I'll still add them to my SECL. Why? Well, Wall Street could begin to react more favorably or their industry group could come to life. If an industry group suddenly becomes strong, I want to know which companies within that space have beaten estimates. I will not include downtrending stocks, no matter how good the earnings report is.
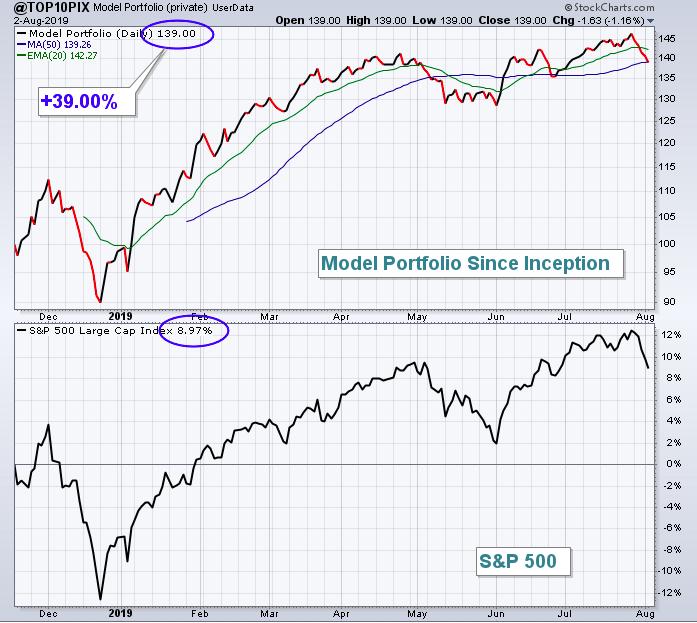
The Model Portfolio came to life after many members of EarningsBeats.com kept asking the same question over and over and over again. "There are 200+ stocks on your SECL. Which 5 or 10 are your favorites?" Finally, I caved on November 19th and the Model Portfolio was born. They're my 10 favorite stocks after reviewing thousands of earnings reports and looking at hundreds of charts. I personally invest in these 10 stocks in my retirement accounts, and they represent many of my short-term trades in my taxable accounts (as do stocks from my Aggressive and Income Portfolios). From my Model Portfolio's inception on November 19th, here are the numbers as of the August 2nd close:
Model Portfolio: +39.00%
Benchmark S&P 500: +8.97%.
That's 30 percentage points of outperformance in 8+ months. In an era where roughly 80% of mutual funds can't keep up with the benchmark S&P 500, I'd say it's working pretty well. Anyone managing money for others should consider at least a portion of their funds in a portfolio filled with relative strength leaders.
Here are the numbers since the latest May 19th selections:
Model Portfolio: +6.82%
Benchmark S&P 500: +2.54%
I track the daily performance with the User-Defined Index feature. Here's a chart of the Model Portfolio's performance since its inception on November 19th:
For those interested, I'll send a link to all of the current Model Portfolio, Aggressive Portfolio and Income Portfolio stocks. Simply send me an email with the subject line "Top 30 Stocks" and I'll send you a link to view them. (This is the same link and list that I offered in my Trading Places blog a week ago, so please don't request it again if you've already received it.) You don't need to be a StockCharts.com member to view the charts, but you will need to be a member to download them into your account. These portfolio stocks are typically reserved for EarningsBeats.com members, so by requesting the link, you agree to sign up as a FREE EarningsBeats.com Digest subscriber. It's sent out 3x per week and I generally contribute a brief article about earnings and/or relative strength 1-2 times per week.
My email is "tomb@stockcharts.com". Feel free to let me know how long you've followed my work and if it's helped you with your trading over the years.
Aggressive Portfolio
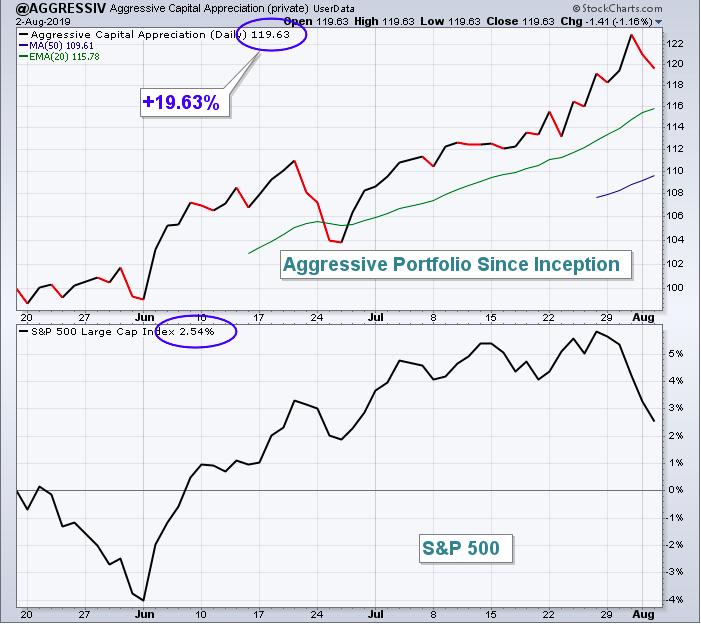
These represent excellent stocks, but they carry more risk due to their volatile nature. They tend to be small- and mid-cap stocks with tremendous relative strength and potential. The idea here is that 1 or 2 stocks will surge higher to carry the portfolio. In the current quarter, 5 stocks in this portfolio are up 10% or more. One is up more than 30%, while the big winner is up 99% (in just 10 weeks!!!). This portfolio was started in response to EarningsBeats.com members wanting a more aggressive group of stocks to trade. Check out these results since the portfolio's inception on May 19th:
Aggressive Portfolio: +19.63%
Benchmark S&P 500: +2.54%
Outperformance of more than 17 percentage points in just 10 weeks is a rather impressive start to this portfolio. Here's the daily performance chart:
The worst stock in my Aggressive Portfolio is -2.8%, and it's the only one that is lower since May 19th.
Income Portfolio
So you're retired and want to participate in the stock market's ascent, but you want to do so with much less risk in the event the stock market moves lower. Is that you? Then you'll love this portfolio. It's filled with many household names, mostly outside of the fast-paced world of technology (XLK) and consumer discretionary (XLY). Every stock in this portfolio pays a dividend, and the average dividend yield was 1.9% at the time of portfolio inception on May 19th. While I compare the Income Portfolio vs. the benchmark S&P 500, outperforming it is simply a bonus. The real idea here is modest capital appreciation with a big helping of safety. I'll know this portfolio is a major success when it significantly outperforms the S&P 500 during a period of declining prices.
So how has it performed thus far (since May 19th inception)?
Income Portfolio: +5.15%
Benchmark S&P 500: +2.54%
Honestly, that's very impressive. There's a personal products company in there. Food companies. A railroad. A waste disposal company. How sexy is that? Yet they've beaten (actually doubled!) the S&P 500 return - due to what? Relative strength. Let's not forget the almost 2% dividend that will be tacked on as well.
Here's the daily performance chart since its inception:
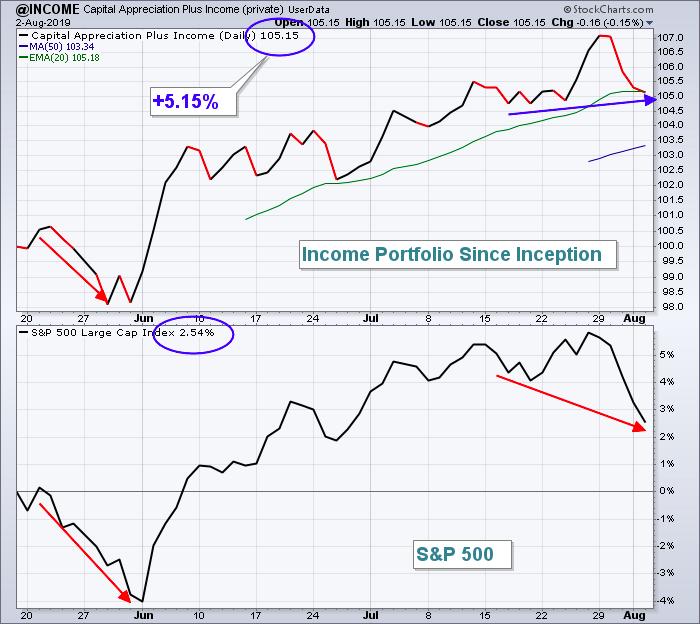
While the S&P 500 has moved mostly higher since May 19th, it's worth mentioning that the 4% move lower in the S&P 500 from May 19th through May 31st resulted in only a 2% drop in the Income Portfolio. Last week, the Income Portfolio performed notably better than the benchmark -again during a market decline. Thus far, that's a couple of "tests" of this approach and the results are solid.
Conclusion
So there you have it. 3 strategies and 3 different portfolios. 3 times that solid fundamentals and relative strength win out. Not only are my 3 portfolios just getting started, but so is the current secular bull market. We've got a long ways to go and I'd love for you to join me on the ride.
Please write me at "tomb@stockcharts.com". In the subject line, write "Top 30 Stocks". I'll also make sure you're set up to receive EarningsBeats.com's free newsletter beginning Monday and I'll send you a link to my current Top 30 stocks - 10 in each portfolio. It's a way of saying thank you for all of your support over the years! :-)
One last thing: the "charts" above of my User Defined Indexes to track the three portfolios are images. You cannot click on them to get live data. Why? Because I have to input the data in my StockCharts.com account. The data is not in your account, so you cannot track it in that manner.
Happy trading!
Tom


