 Weekly RRG showing US sectors vs. SPY
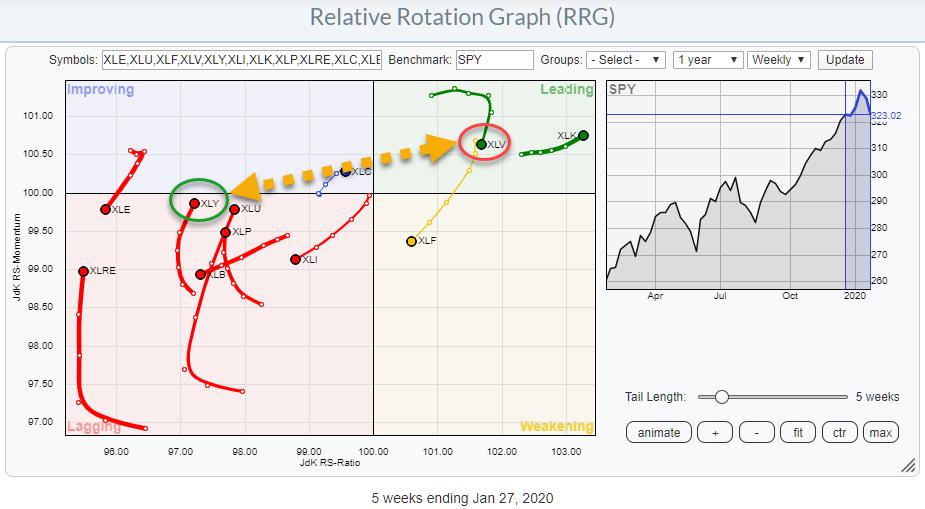
The Relative Rotation Graph above shows the weekly rotation for US sectors against SPY (S&P 500). While the S&P 500 chart is deteriorating and seems to be going into a correction, there are two tails on the RRG that suggest an interesting trade setup. (I already hinted and briefly discussed this one in last week's Sector Spotlight.)
What we are talking about are the opposite rotations currently underway for the Consumer Discretionary sector (XLY) and Health Care (XLV).
On the weekly RRG above, we see XLV inside the leading quadrant but rolling over in the past two/three weeks, after only a short period inside this quadrant (entry December 2019). On the opposite side, in the lagging quadrant, the tail for XLY started to curl upward at the start of January and has recently also started to gain on the JdK RS-Ratio axis. This means that the sector is now at a positive RRG-Heading.
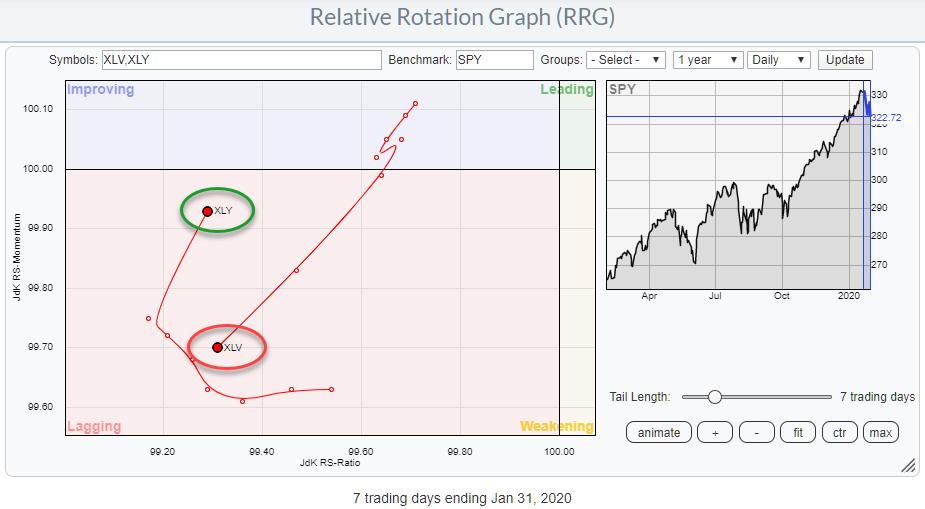
The daily RRG below shows the shorter-term rotation for both sectors (isolated).
 Daily RRG showing rotations for XLY and XLV against SPY
On this version of the Relative Rotation Graph, we find both sectors inside the lagging quadrant; both are also at opposite rotations. Where XLY is following a normal gradual rotation from leading through weakening into lagging (and now on its way to improving), XLV shows a quick reversal down after rotating into the improving quadrant.
Both sectors, especially XLV, are showing an acceleration of their rotations, which can be seen by the increased distance from observation to observation on the tails.
In essence, this rotation is confirming/supporting the longer-term rotation that is visible on the weekly RRG.
Time to inspect both of their price charts:
Health Care - XLV
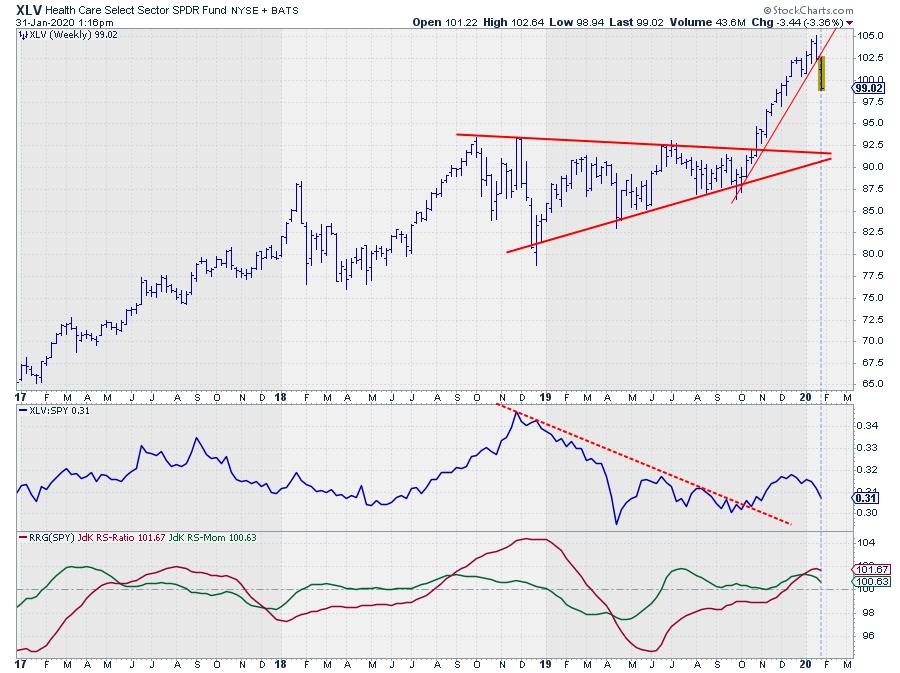
After breaking out of the consolidation/triangle in October, XLV showed a very nice and steep uptrend until it peaked last week at $ 105. The recent decline broke the steep rising support line, which ends this initial rally after the break.
The next thing to wait-and-see for is where the next low will be formed. The educated guess is somewhere between $92.50-$95.00. This is the area where the peaks in 2018 were formed and the level at which the former resistance line is; the latter is now expected to offer support.
The relative strength vs. SPY got a dent as well from the recent decline in price. The break of resistance in October was a positive, but we now need a new higher low to come in rapidly to maintain this positive element from this break. It looks questionable as to whether that will happen, IMHO. Meanwhile, the RRG-Lines are rolling over, which is causing the downward rotation of the tail inside the leading quadrant.
Going forward, we have a price chart that seems set for a further downward correction, while relative strength is weakening.
Consumer Discretionary - XLY
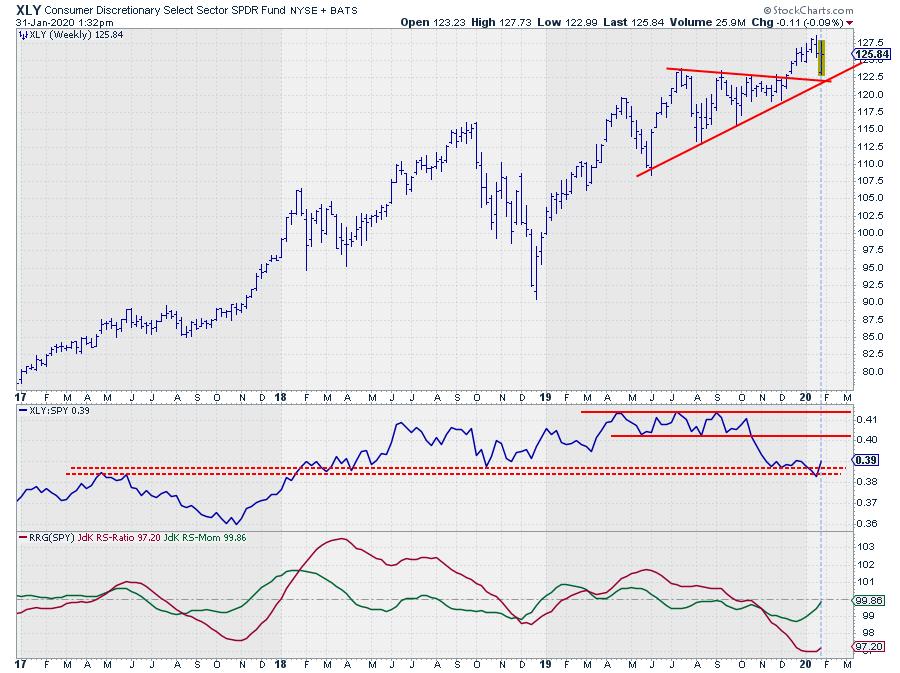
XLY also broke out of a consolidation/triangle formation in December, but the follow-through rally was not so strong, as we saw in XLV above. What we do see here is that the corrective move of this week was caught by support coming from the former resistance line, as well as the extended rising support line that marked the lower boundary of the consolidation.
The relative strength for this sector actually declined during the consolidation, only starting to level off after the break. Despite the weak price performance of this week, relative strength bounced off a support area, marked by the two dashed lines, and the RRG-Lines started to curl back up, with JdK RS-Momentum almost pushing above 100.
All in all, the opposite rotations for these sectors on both the weekly and the daily RRGs suggest that we should have a preference for Consumer Discretionary stocks over Health Care in coming weeks.
Does that make sense while the general market is deteriorating? Particularly when a rotation towards "defensive" sectors like Utilities and Staples - and, historically, Health Care - and OUT of "offensive" sectors like Discretionary would be more in line with expectations?
I don't know. Staples and Utilities seem to be respecting the historical pattern, but, as far as I can see, Health Care is not. At least, not so far. And neither does Discretionary.
It is an early call, and things can change, but, for now, I am going to follow what I see and not what I think I should see. ;)
Enjoy your weekend!!
--Julius
My regular blog is the RRG Chartsblog. If you would like to receive a notification when a new article is published there, simply "Subscribe" with your email address.
Julius de Kempenaer
Senior Technical Analyst, StockCharts.com
Creator, Relative Rotation Graphs
Founder, RRG Research
Want to stay up to date with the latest market insights from Julius?
– Follow @RRGResearch on Twitter
– Like RRG Research on Facebook
– Follow RRG Research on LinkedIn
– Subscribe to the RRG Charts blog on StockCharts
Feedback, comments or questions are welcome at Juliusdk@stockcharts.com. I cannot promise to respond to each and every message, but I will certainly read them and, where reasonably possible, use the feedback and comments or answer questions.
To discuss RRG with me on S.C.A.N., tag me using the handle Julius_RRG.
RRG, Relative Rotation Graphs, JdK RS-Ratio, and JdK RS-Momentum are registered trademarks of RRG Research.
Julius de Kempenaer
Senior Technical Analyst, StockCharts.com
Creator, Relative Rotation Graphs
Founder, RRG Research
Host of: Sector Spotlight
Please find my handles for social media channels under the Bio below.
Feedback, comments or questions are welcome at Juliusdk@stockcharts.com. I cannot promise to respond to each and every message, but I will certainly read them and, where reasonably possible, use the feedback and comments or answer questions.
To discuss RRG with me on S.C.A.N., tag me using the handle Julius_RRG.
RRG, Relative Rotation Graphs, JdK RS-Ratio, and JdK RS-Momentum are registered trademarks of RRG Research.
