"This new Symbol Summary is a game changer!"
-----
"Holy smokes! The new Symbol Summary page is amazing. Like WOW. StockCharts is now truly my one-stop shop for everything stock related."
-----
"I just wanted to tell you how much I am enjoying the new Symbol Summary feature. It is the first place I go when viewing my charts, and I have found it very helpful when deciding whether to buy, sell, or hold."
-----
You all said it best, so I guess my job's done. I mean, I was planning to write about how great our new Symbol Summary page is. But in the past few days, we've seen an outpouring of positive feedback, excited reviews and thankful comments from hundreds and hundreds of users. There's nothing more powerful than what you all tell us, so I wanted to share and also give a very big "thank you" to everyone for the warm words about our newest tool.
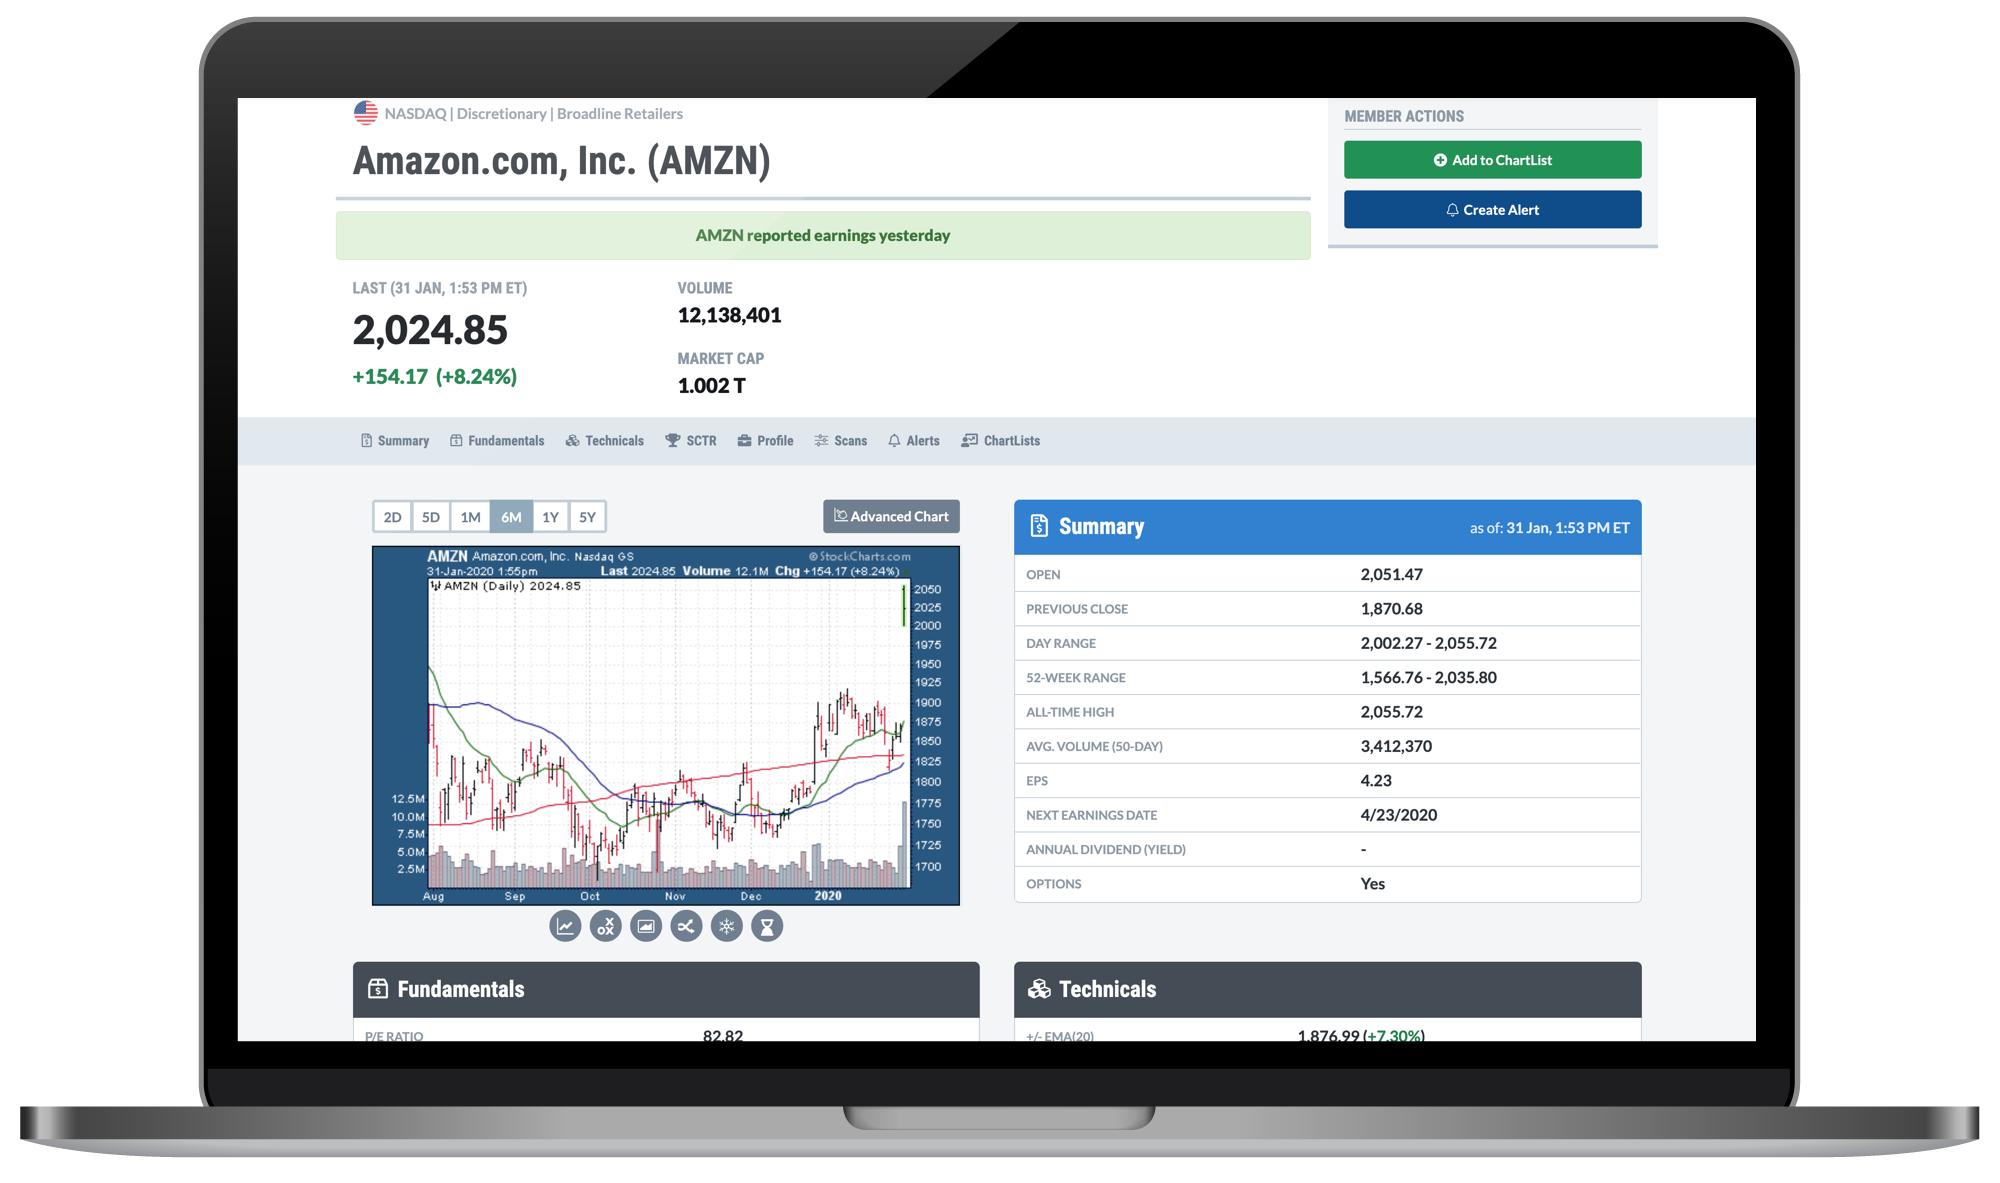
If you're wondering what this is all about, let me fill you in. Last week, we released our new Symbol Summary page, an extensive research tool featuring full quote information for stocks, ETFs, mutual funds, indexes, and cryptocurrencies. From a single page, you can view technical stats, fundamentals, earnings, dividends, corporate info and much more.
Here's How It Works

From any page on StockCharts, click the dropdown menu to the left of the search bar and select the "Symbol Summary" option from the menu that appears. Enter a ticker and hit "Go" to pull up a ticker on the Symbol Summary.
From there, you'll be able to see the latest price info, view a chart in multiple timeframes, browse high-level summary stats, fundamentals and popular technicals, get earnings dates and dividend info, visualize the symbol's latest SCTR info, read full company or fund descriptions, and much more. Alongside SharpCharts, the Symbol Summary is your go-to resource for analyzing any stock, ETF, index or other security covered on StockCharts.
On top of that, this is only the start of a significant data expansion here at StockCharts. Very soon we'll be introducing even more fundamental data, complete earnings history, after-hours prices, analyst ratings, and much more. On the Symbol Summary AND our charting tools like SharpCharts and ACP (yep, charting fundamentals is coming!), we have many other major additions already in the works.
If you didn't catch the newsletter last weekend, be sure to click here and read my announcement article about the Symbol Summary. It describes all of the new data we've added and covers the many unique features of this tool, and I'm sure you'll find it helpful.
Let Us Know What You Think
Seriously, don't stay quiet! We love hearing from all of you about what's working, what's not, what you enjoy, what you need – all of it. We do have lots more coming to StockCharts as we continue to roll out coverage for the new fundamental data, earnings info, analyst ratings and more, but keep the feedback coming. Our mission is to help you get the most value out of our tools and features, and your input only helps make that happen.
Chart on, my friends.
- Grayson Roze
VP of Operations, StockCharts.com
Author, Trading for Dummies (Wiley, 2017)
Author, Tensile Trading (Wiley, 2016)
Chart on, my friends.
Grayson Roze
- Director of Operations, StockCharts.com
- Author, Trading For Dummies (Wiley, 2023)
- Author, Tensile Trading: The 10 Essential Stages of Stock Market Mastery (Wiley, 2016)
- Co-Founder, StockMarketMastery.com
- Twitter: @GraysonRoze