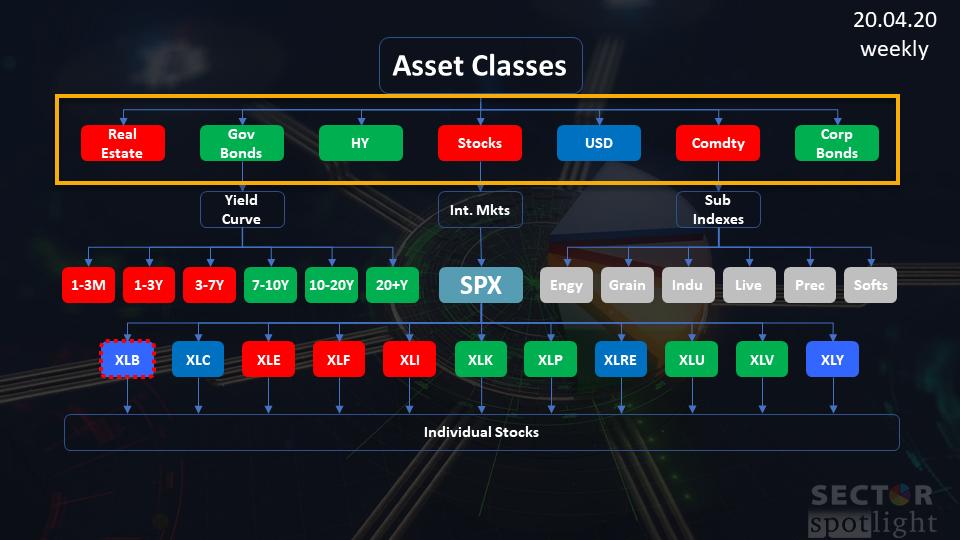
In the latest episode of my StockCharts TV series Sector Spotlight, I took an in-depth look at the relative rotation of asset classes vs. VBINX, the Vanguard Balanced Index fund, which represents a 60/40 stocks/bond portfolio. The image above shows the investment pyramid that I use to show a top-down approach from asset classes down to individual stocks.
In this article, I will share the most important charts from that episode.
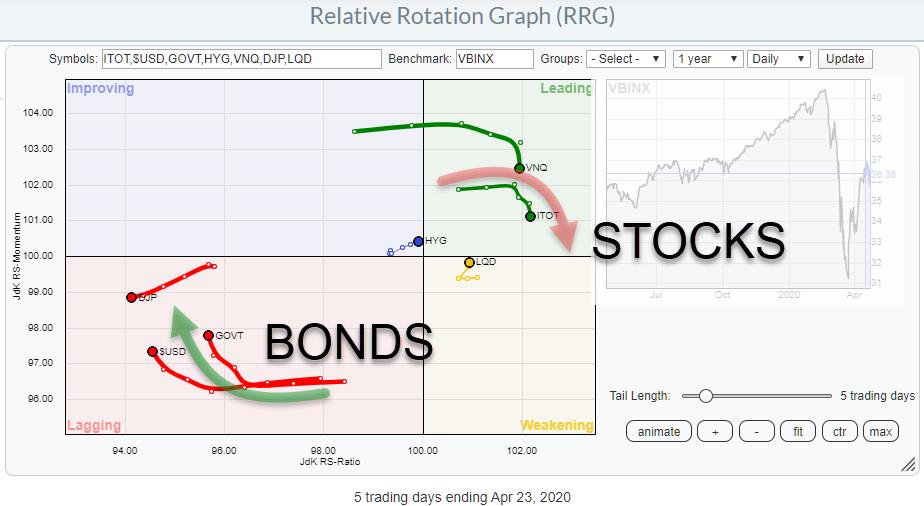
Weekly Asset Class Rotation on RRG
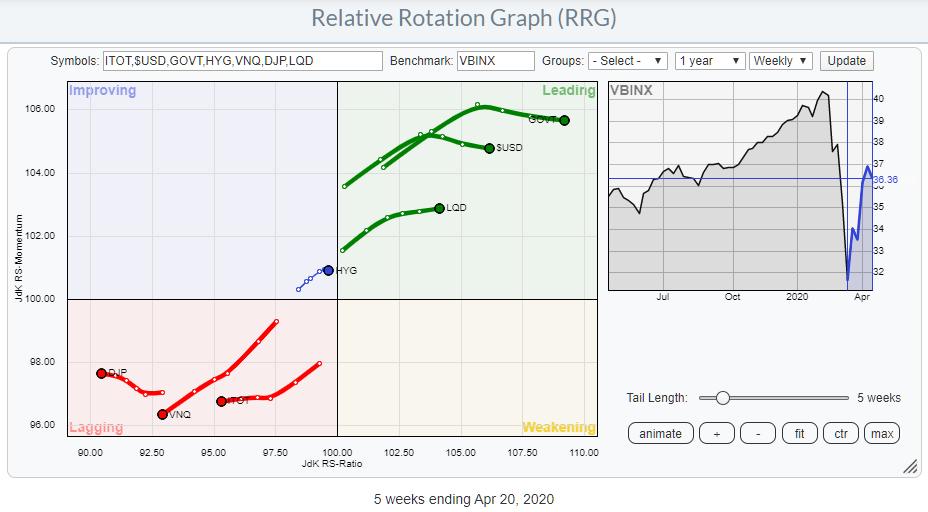
The starting point for this pyramid is the Relative Rotation Graph above, showing the rotation of all asset classes. The benchmark that I use for this setup is the Vanguard Balanced Index Fund (VBINX), which represents a typical balanced portfolio mad up of 60% stocks and 40% bonds.
This RRG shows GOVT, USD and LQD are well inside the leading quadrant while HYG is inside improving, very close to the leading quadrant and also close to the benchmark. DJP, VNQ and ITOT are all well inside the lagging quadrant and traveling further into it.
The immediate takeaway from this RRG is the "RISK-OFF" message that it is sending. In this respect, the two most important charts are those of ITOT and GOVT.
iShares Core S&P Total US Stock Market
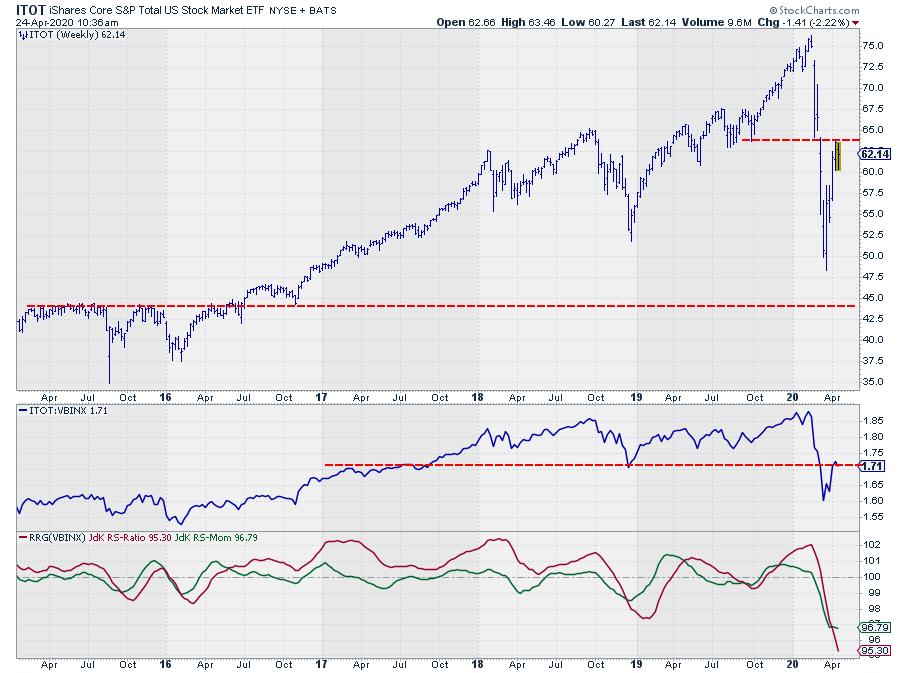
After the steep drop ITOT, started recovering very rapidly, but this rally stalled against the level of lows that were put into place in mid-2019.
The Relative Strength of ITOT against VBINX also rallied after dipping to three-year lows, but is now stalling against a horizontal barrier that lines up with highs from 2017 and the important low of late 2018.
For both graphs, this is a pretty crucial level. If the market is able to break above these resistance levels, we may see a bit more upside in coming weeks. When we are putting a high into place, it will be the first lower high after the February peak for both price and RS.
iShares Core US Treasury Bond
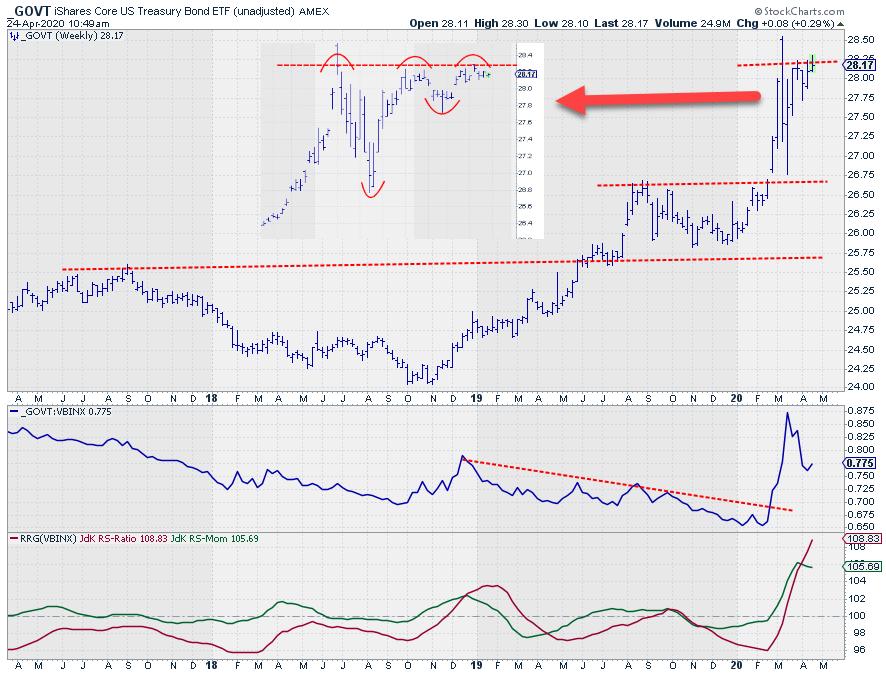
GOVT has been trading almost exactly opposite of ITOT, which is what you would expect in a flight to safety. So no real surprise there.
However, just like ITOT, GOVT has now reached an important price level and it seems as if the market is trying to move higher. On the inset daily chart, it can be seen that the area just above $28 is now being tested as resistance. A break higher will most likely lead to a further acceleration of bond prices, pushing US yields lower.
The rapid improvement in relative strength when stocks started to fall came off after the initial rally, but a new, higher, low seems to be in the making.
To assess the most likely move in the coming weeks, we need to look at the daily rotation for asset classes.
Daily Asset Class Rotation on RRG
On this graph, we find ITOT inside the leading quadrant tracing out the recovery of the market after putting in its low. Meanwhile, on the opposite side, we find GOVT inside the lagging quadrant as a result of the stalling rally.
BUT!!
Both tails have started to roll over during the last two to three days. And, with the tails of these two asset classes where they are (on the RRG) at the moment, this daily rotation suggests that the recovery for stocks, as well as the pause for bonds, is coming to an end - and that the main trend could be resuming any time soon.
The final trigger to confirm this will be a break higher in bonds and a failure to do so in stocks. The move that will follow, especially in the stock market after putting in a lower high, will be crucial in determining the direction of the market in coming months. Will the March low hold - or will it be broken?
#StaySafe,
--Julius
My regular blog is the RRG Charts blog. If you would like to receive a notification when a new article is published there, simply "Subscribe" with your email address.
Julius de Kempenaer
Senior Technical Analyst, StockCharts.com
Creator, Relative Rotation Graphs
Founder, RRG Research
Host of: Sector Spotlight
Please find my handles for social media channels under the Bio below.
Feedback, comments or questions are welcome at Juliusdk@stockcharts.com. I cannot promise to respond to each and every message, but I will certainly read them and, where reasonably possible, use the feedback and comments or answer questions.
To discuss RRG with me on S.C.A.N., tag me using the handle Julius_RRG.
RRG, Relative Rotation Graphs, JdK RS-Ratio, and JdK RS-Momentum are registered trademarks of RRG Research.


