Let me give you an update as to how the SPY (ETF that tracks the S&P 500) and QQQ (ETF that tracks the NASDAQ 100) have performed since the top on February 19th, broken down by opening gaps (net) and intraday price action:
SPY:
- Closing price, 2/19/20: 336.36
- Opening gaps, net: -71.16
- Intraday price action, net: +13.00
- Closing price, 4/9/20: 278.20
QQQ:
- Closing price, 2/19/20: 236.45
- Opening gaps, net: -41.01
- Intraday price action, net: +5.42
- Closing price, 4/9/20: 200.86
Since February 19th, the SPY and QQQ are down 17.29% and 15.05%, respectively. However, it's been the fear at the opening bell that's driven U.S. equities lower. If we viewed only the price action from the opening to closing bells, we wouldn't even know there was a crisis. Put another way, if you had invested $100,000 at the opening bell and sold at the closing bell every day since February 19th, the balance in your portfolio investing in the SPY and QQQ would be as follows:
SPY: $105,748.59
QQQ: $103,457.89
So, while everyone has made a habit of panicking given the mostly weak futures over the past 7 weeks, willing buyers have emerged throughout most trading days. This SCREAMS accumulation to me. In that regard, the 2020 COVID-19 crisis has been completely different from the 2008 financial meltdown. In 2008, there was mass distribution throughout trading days and we moved lower. We really haven't seen that this time around and the apparent accumulation would suggest the likelihood of a much quicker recovery, in my opinion.
Will we see a double bottom? That's a great question and one that will likely be answered this week. Our key indices have seen prices rebound and test critical Fibonacci retracement levels at both 38.2% and 50.0%. Our initial rebounds in 1987 and 2008 never closed above the 50.0% Fibonacci retracement level. Here's where we stand now on the $SPX:
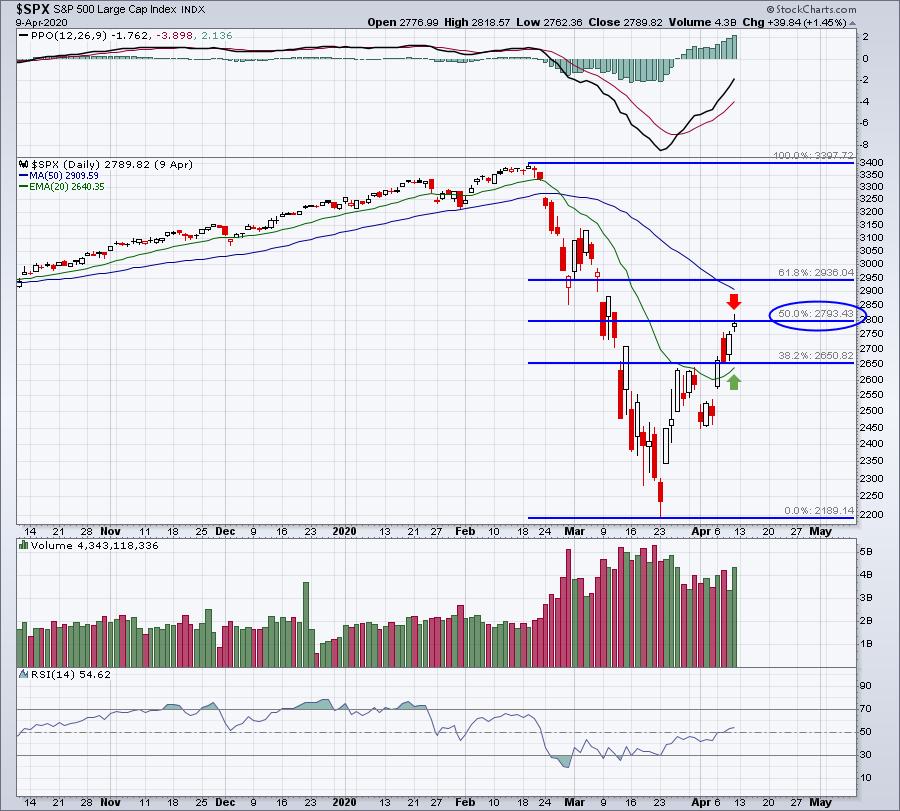
I'd like to be able to pull out the "Pandemic Playbook," but I don't own one. This is new territory for me and for everyone else who wasn't investing in 1918 during the Spanish Flu pandemic. But I do know that the March 23rd low was accompanied by a VIX reading in the 80s. That's a "throw the kitchen sink in" type of sentiment reading. Extreme bearish sentiment marks MAJOR stock market bottoms and I'd be willing to bet at this point that the bottom is in.
But what if we start to go back down?
Well, I'm prepared either way. I've used the last several weeks to do a lot of thinking and analyzing. Wall Street sends us signals all the time if we would only pay attention. High volatility has resulted in a massive decline followed by an impressive rally, while much rotation has taken place in the stock market. I mentioned above that the S&P 500 and NASDAQ 100 are down roughly 17% and 15%, respectively. Many sectors and industry groups, however, are showing relative strength and it's our job to seek out those winners. From a sector perspective, healthcare (XLV) is down just 8.41% since February 19th, easily the best-performing sector. Two of its five industry groups have lost just 5% and 6%, respectively. Wall Street is placing its bets and we need to know the stocks that are (1) performing well on a relative basis and (2) being accumulated.
I've put together a ChartList of 354 companies that show confirming signs of both. Let me explain how I constructed this list.
First, I ran a scan of stocks in every individual sector that has SCTR scores > 80. Here's a sample of the utilities scan:
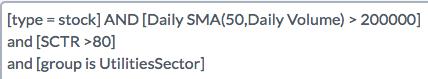
I also included a minimum average volume of 200,000 to make sure the stocks were liquid. After running the scan, I pulled up all the stocks in "CandleGlance" form so that I could quickly go through and eliminate the stocks that had poor accumulation/distribution lines (AD lines). Here were two that showed strong AD lines and are on my final list:
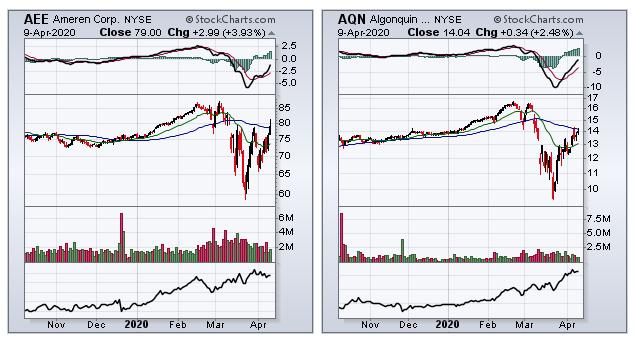
Rising accumulation/distribution lines, together with excellent relative strength, really provides us a big advantage in trading right now; I'll show you how tomorrow.
On Saturday, April 11th, at 10:00am EST, I'm hosting a webinar, "Changing Conditions Require a Changing Game Plan". Conditions have changed with COVID-19 - I think most everyone can agree with that. Wall Street is telling us which industry groups and stocks we should consider as we look ahead. I will share my just-developed AD ChartList (with 354 charts) with those who are EarningsBeats.com members and also at least Extra members at StockCharts.com. (You'll need to be an Extra member in order to download this ChartList.) I'll show you in tomorrow's webinar how you can click a link on our website, enter a password and download this ChartList into your StockCharts account. It'll take you 10-15 seconds. It's simple.
Tomorrow's webinar will likely last 60 to 90 minutes and I'll be discussing the winning sectors, industry groups and stocks that you need to be aware of given the changing stock market conditions. It's an opportunity to bring our EarningsBeats.com community together during this period of social distancing. Now is the time to gain additional insight and education. Tomorrow's agenda, along with a link to sign up for your fully refundable $7 30-day trial, can be found HERE.
Happy trading!
Tom


