Editor's Note: This is an updated version of an article originally posted on Martin Pring's Market Roundup on April 21, 2020.
In recent articles, I have pointed out that quite a few of the short-term indicators reached well beyond their normal oversold readings at the March lows. Historically, this is has been a very bullish characteristic, often signaling the end of a bear market. The difference between now and most of the previous instances is that the 2020 decline came straight after the February all-time peak. As a consequence, the long-term indicators have not had sufficient time to correct their overbought condition.There have only been two previous occasions when the Dow had experienced a 25% drop so soon after registering a new all-time high: 1929 and 1987. The former was followed by a major bear market as the economy and equity prices both dropped sharply. In 1987, by contrast, the economy remained strong and the stock market recovered without falling lower. There is a third possibility that I overlooked, which Greg Schnell reminded me of earlier this week, that being the initial decline from the 2000 top in the NASDAQ Composite.
The point I am trying to make is that those initial 1929 and 2000 lows held for 8 months to a year. The 1987 bottom has never been violated. While we may well be into a bear market, it's important to understand that the low of last March will likely, for all intents and purposes, hold for a long time. "All intents and purposes" means that the lows could be penetrated but not on a sustainable basis, and that's what should be borne in mind as we move forward.
Time for a Test of the Low
I am not a great fan of Fibonacci retracements, in the sense that I rarely use them to signal where a move might end. After all, there are several choices, including 61.8, 38.2% and 23.6%. Instead, I prefer to observe when a retracement has taken place, subsequently looking around to see whether other technical evidence fits in with a reversal scenario.
In that respect, Chart 1 shows that the NASDAQ composite is right at resistance in the form of a 61.8% retracement of its COVID-19 collapse. That compares almost identically with the early fall recovery following the initial NASDAQ drop in the tech bubble in 2000. In 1930, the retracement after the 1929 crash low for the Dow was 50%.
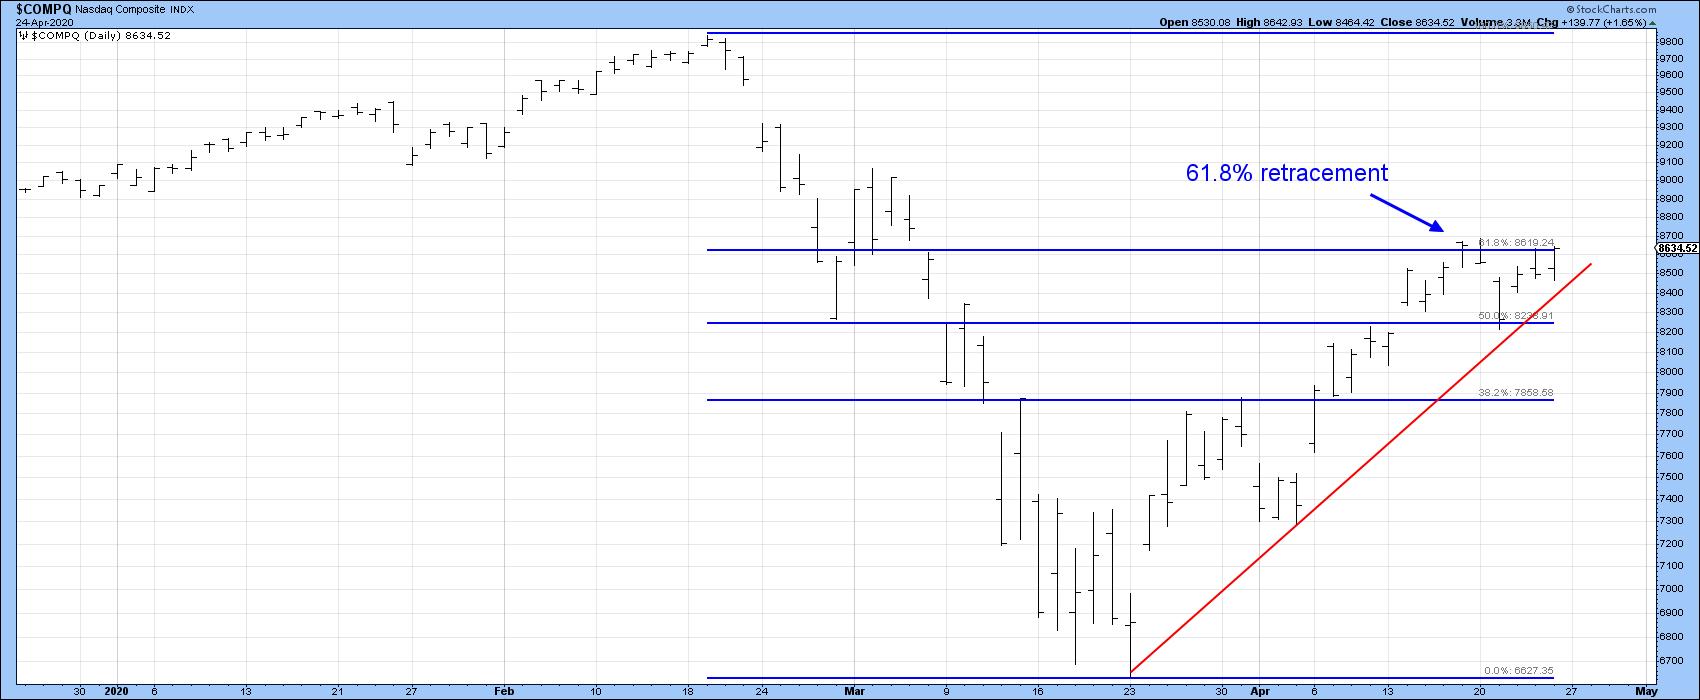
Chart 1
Looking around for corroborating evidence of a possible reversal, we see in Chart 2 that the NASDAQ was unable to hold below its 200-day MA last week. That's a positive sign as long as it holds. However, the RSI has so far failed to register an overbought reading. This kind of action is more akin to a bear market characteristic than an initial rally in a new bull market. At the moment, both the price and the RSI remain above their respective up trendlines. However, if these support benchmarks are violated in a decisive manner, that would suggest some kind of a test of the March lows.
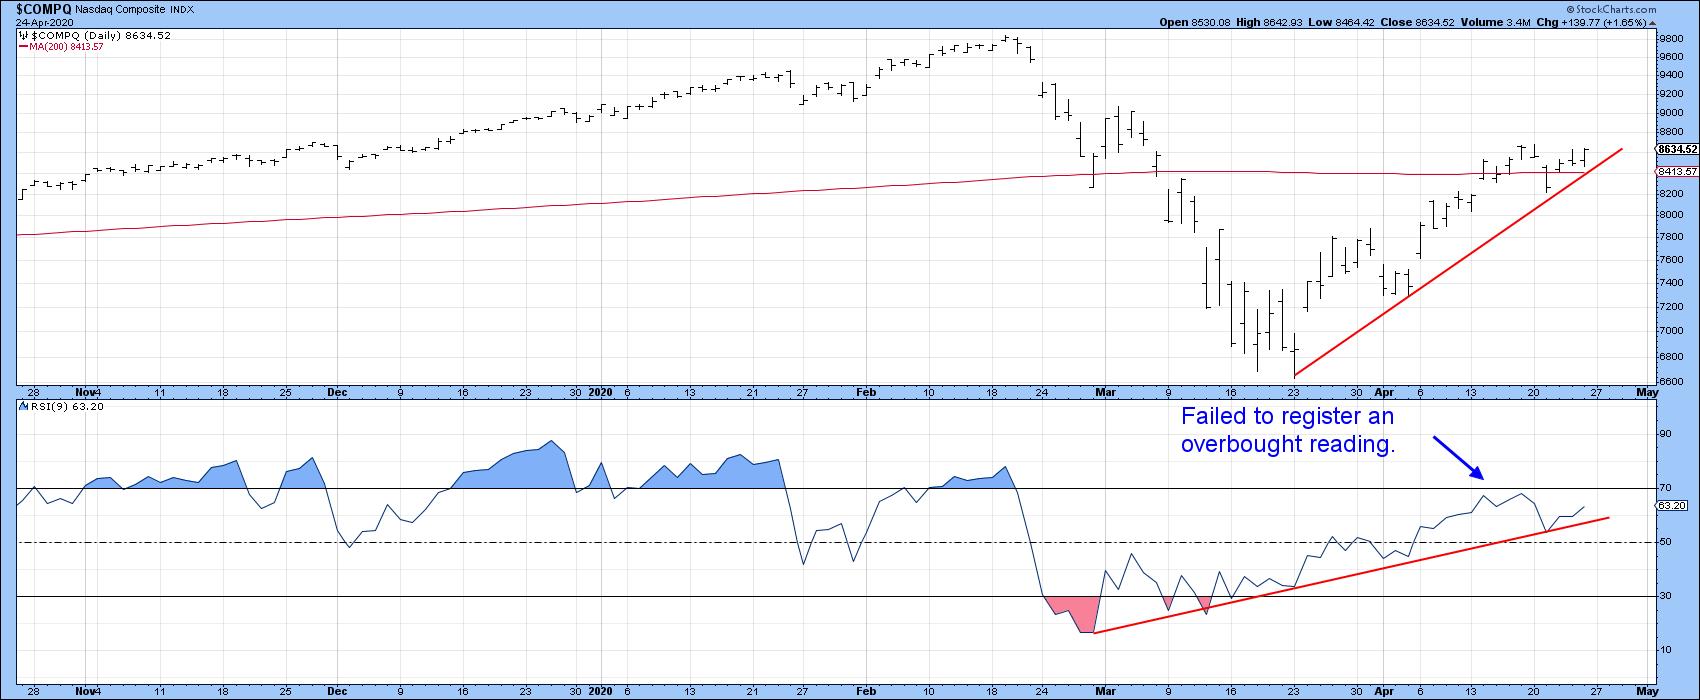
Chart 2
The near-term technical picture for the S&P Composite is weaker. Chart 3 shows that it remains below the extended up trendline emanating at the March lows. That line is only a month in length, so its penetration is not the end of the world. However, the failure of the RSI to again register an overbought condition is a worrying factor. Finally, it's true that the RSI has not yet violated its up trendline. However, the Index has, and even if it moves sideways, that lack of upside momentum would cause the RSI will soon follow.
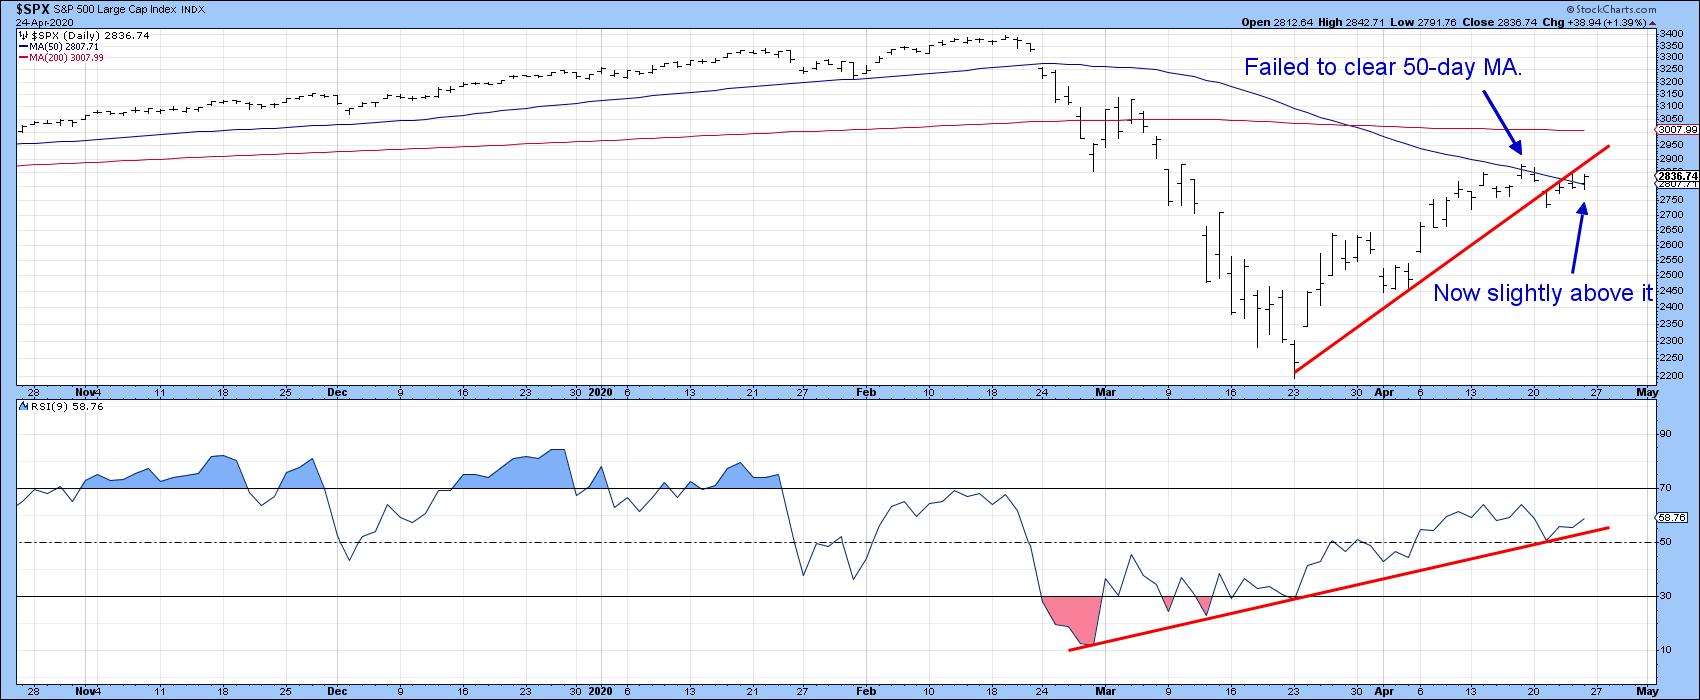
Chart 3
Finally for the S&P, Chart 4 shows its hourly progress since the rally began. It is fairly evident that the RSI peaked several sessions ago and has been getting weaker ever since. This action has now been confirmed by the Index, which has violated the up trendline and completed a broadening wedge.
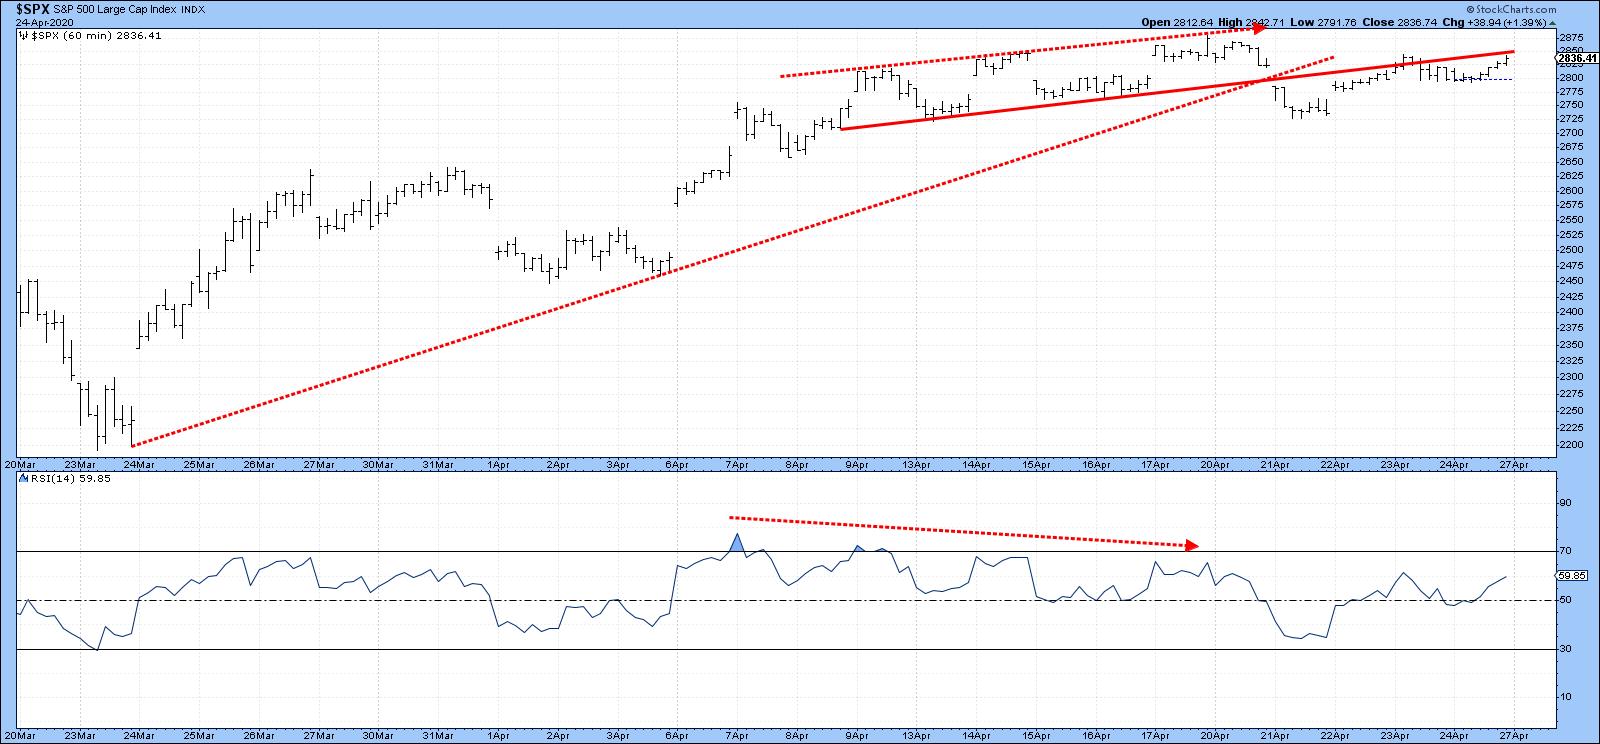
Chart 4
Chart 5 shows that the more broadly-based NYSE Composite has completed a bearish pennant at the same time that the RSI completed an upward-sloping head-and-shoulders top. The retracement rally for the NYA came within a whisker of 50%, which is a reasonable place to expect a pause in the advance.
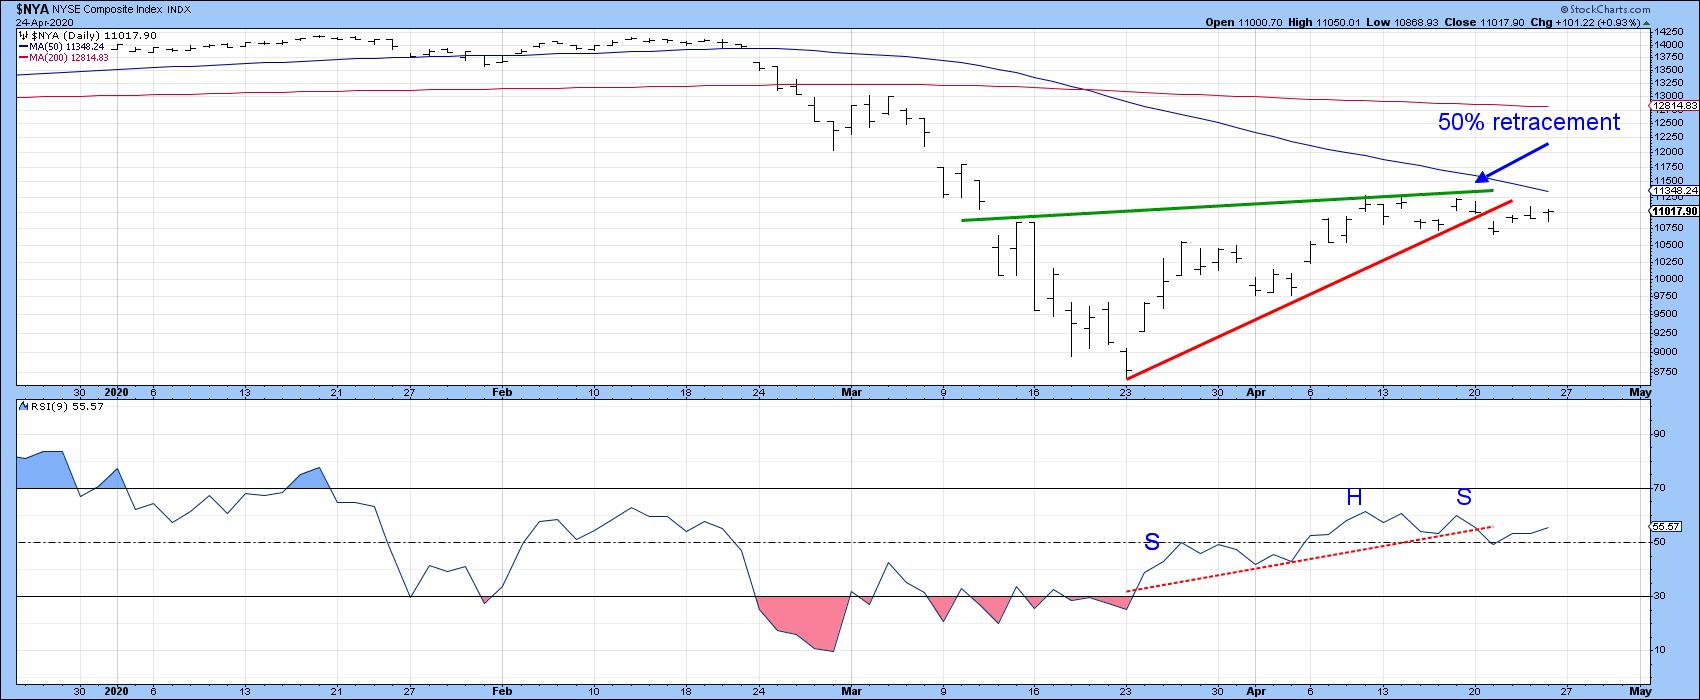
Chart 5
In these volatile times, it's quite possible that a lot of these short-term discrepancies get cleared up and we move to new recovery highs. As it stands now, though, a NASDAQ 61.8% flag and an NYA 50% one have been raised, which means that next week's action is likely to be critical in either direction.
Good luck and good charting,
Martin J. Pring
The views expressed in this article are those of the author and do not necessarily reflect the position or opinion of Pring Turner Capital Group of Walnut Creek or its affiliates.


