Chartists can separate the leading sectors from the lagging sectors by sorting with various breadth indicators. The 200-day EMA is a long-term trend indicator that can also be used as a breadth indicator. A stock is in an uptrend when above the 200-day EMA and in a downtrend below. The chart below shows two examples from the Healthcare sector.
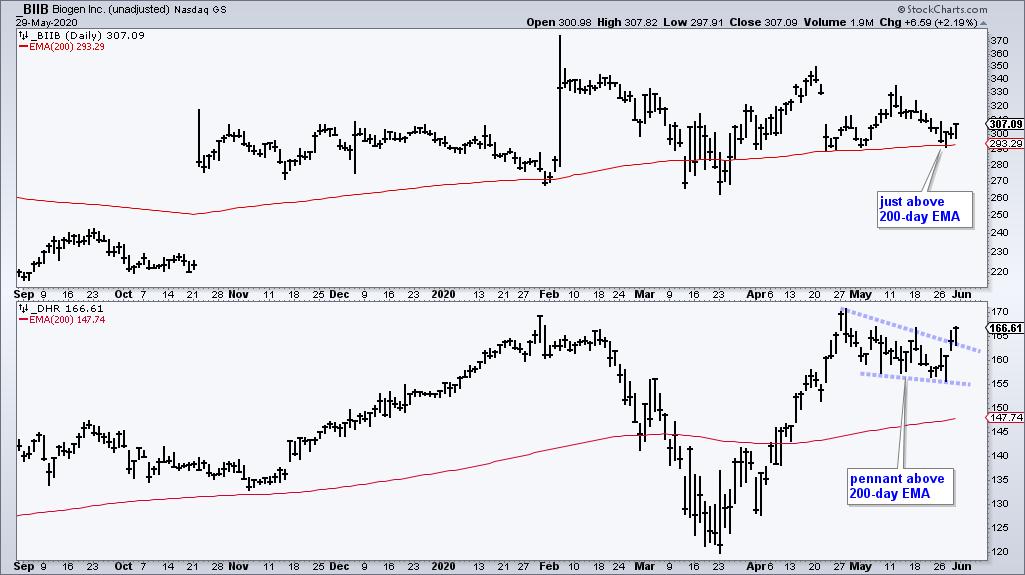
Chartists can turn this trend indicator into a breadth indicator by counting the number of stocks in a sector that are trading above or below this EMA. Don't worry. You do not have to run a scan or count the charts by hand. StockCharts has done the work for you with an array of sector breadth indicators. The percentage of stocks above the 200-day EMA is one of my favorites because it immediately tells me how many stocks within the sector are in long-term uptrends.
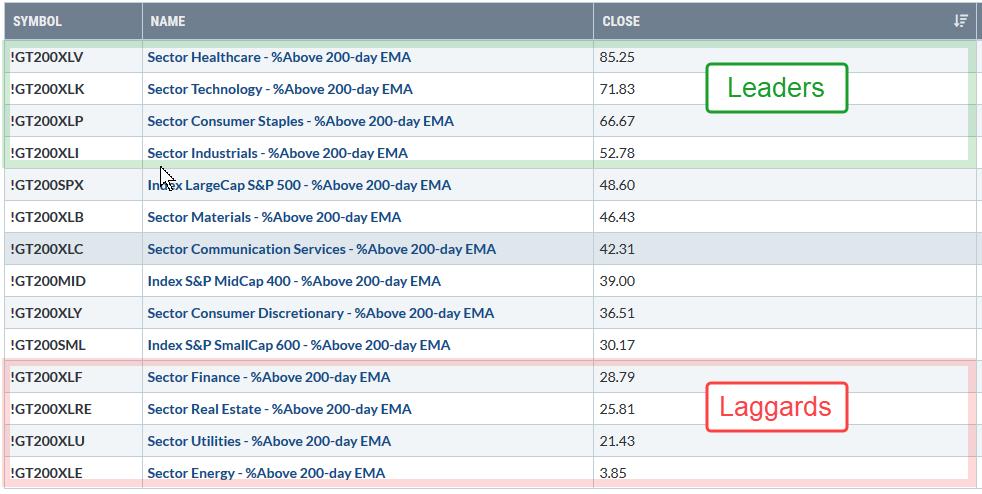
The table above shows the percentage of stocks above the 200-day EMA for the 11 sectors and three major indexes. Healthcare and Technology stand head and shoulders above the rest with readings above 70%. Consumer Staples is second with over 60% and the Industrials sector is in fourth place with a move above 50% this week. Note that these numbers are based on Thursday's close.
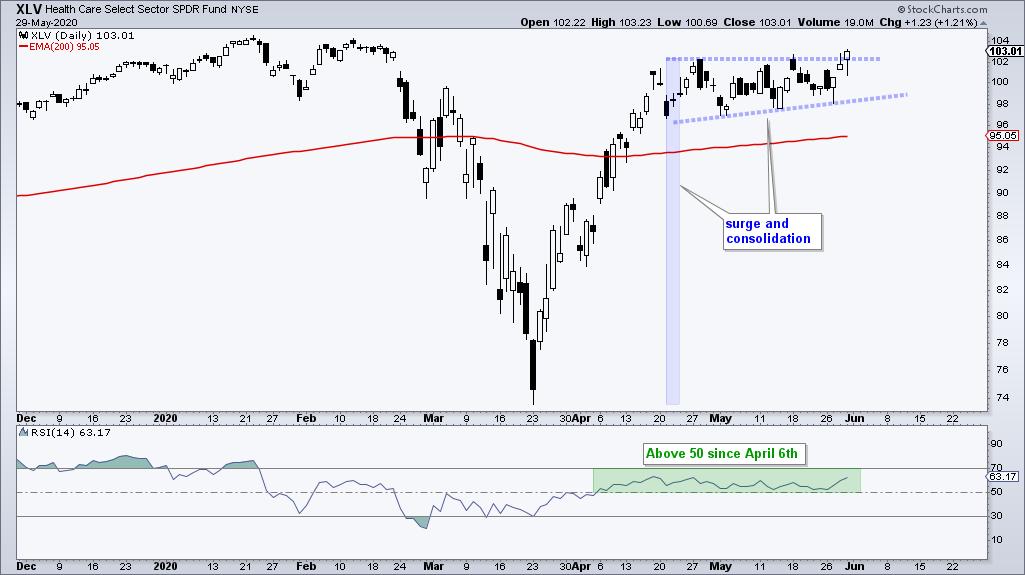
The Healthcare sector shows bullish breadth overall and the Healthcare SPDR (XLV) is above its 200-day EMA. This bullish combination means Healthcare should be on our watchlist for bullish patterns and setups. In fact, the ETF is forming one right now as a small consolidation takes place after a strong advance. This is a bullish continuation pattern and this week's upside breakout signals a continuation higher.
I maintain a breadth model using the 11 sector SPDRs and three indicators for each sector at TrendInvestorPro.com. Healthcare is the only sector with all three indicators on bullish signals. In fact, only three sectors are net bullish and eight are still bearish. Subscribe today for immediate access to this model, ETF rankings and the weekend video.
Click here to take your analysis to the next level!
------------------
Choose a Strategy, Develop a Plan and Follow a Process
Arthur Hill, CMT
Chief Technical Strategist, TrendInvestorPro.com
Author, Define the Trend and Trade the Trend
Want to stay up to date with Arthur's latest market insights?
– Follow @ArthurHill on Twitter
