Stocks in general are undergoing some profit-taking today. And consumer cyclicals are one of the day's weakest groups. A big reason for that is today's big drop in Amazon.com (AMZN). Chart 1 shows that influential stock dropping -7% today on last evening's reported drop in first quarter earnings. And it's now testing initial chart support along its late-April lows near 2300. If that doesn't hold, more substantial support is likely along its February peak at 2185. The upper box shows its 14-day RSI line starting to weaken from overbought territory over 70. And its daily MACD lines (middle box) are in danger of turning negative for the first time since mid-March. That raises the possibility of more profit-taking to come. Because of its size, what AMZN does has a big influence on the direction of consumer cyclicals which are trading lower today.
Chart 1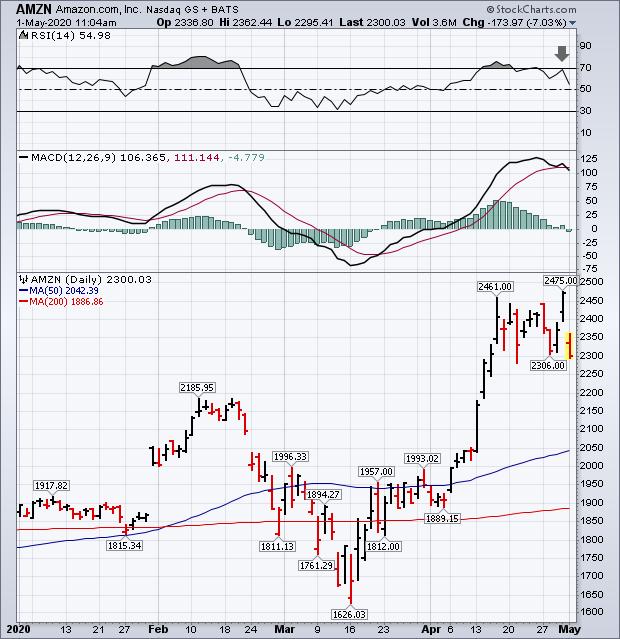
The daily bars in Chart 2 show the Consumer Discretionary Sector SPDR (XLY) pulling back sharply from its 200-day moving average. Some of its biggest losers include cruise lines, hotels, and gaming stocks which have rebounded over the past week. Today's drop in Amazon, however, is also a big reason for the pullback. That's because that stock accounts for more than quarter of the XLY weightings. So what AMZN does has a big influence on the XLY. Which today is negative.
Chart 2
Semiconductor stocks are also coming under selling pressure today. Chart 3 shows the PHLX Semiconductor iShares (SOXX) down nearly -4% today and dangerously close to falling below its 200-day line. One of its biggest losers is Lam Research (LRCX). Chart 4 shows that chip stock already falling below its 200-day average to the lowest level in nearly a month. Selling in chip stocks may also start to weigh on the tech sector and Nasdaq which are still trading above their 200-day lines. With help from some of the biggest tech stocks.
Chart 3
Chart 4
Editor's Note: This is an excerpt of an article that was originally published in John Murphy's Market Message on Friday, May 1st at 11:12am ET. Click here to read the full article, which includes Charts 5-6 and a discussion of the Nasdaq Composite Index.
