One of my favorite ratios to track offense vs. defense within the equity markets is the Consumer Discretionary sector (XLY) divided by the Consumer Staples sector (XLP). But a look under the hood shares narrow leadership and questionable upside.
Below, we see the S&P 500 ETF along with the ratio of Consumer Discretionary vs. Consumer Staples.
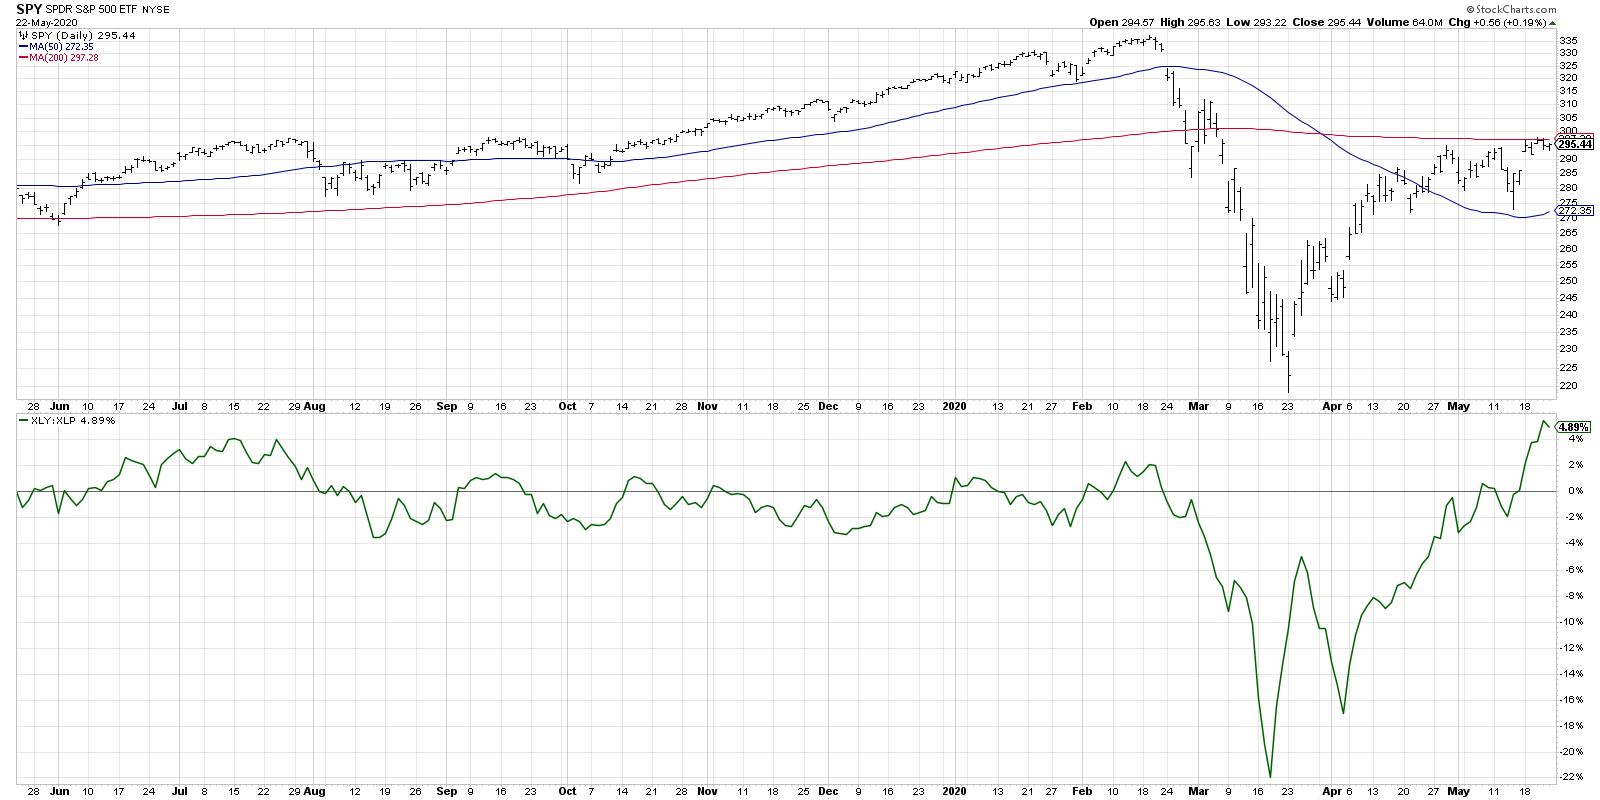
When this ratio is increasing, the assumption is that institutions are rotating more to the offense, like retailers, luxury goods and discretionary purchases. When the ratio turns lower, you can assume that investors are moving more toward traditional defense like beverages and household goods.
The ratio bottomed out before the market low in mid-March and broke to an important new swing high in late April. The last week saw this ratio finally break above its February high, confirming a broad move into Consumer Discretionary.
But does it really suggest a broad move?
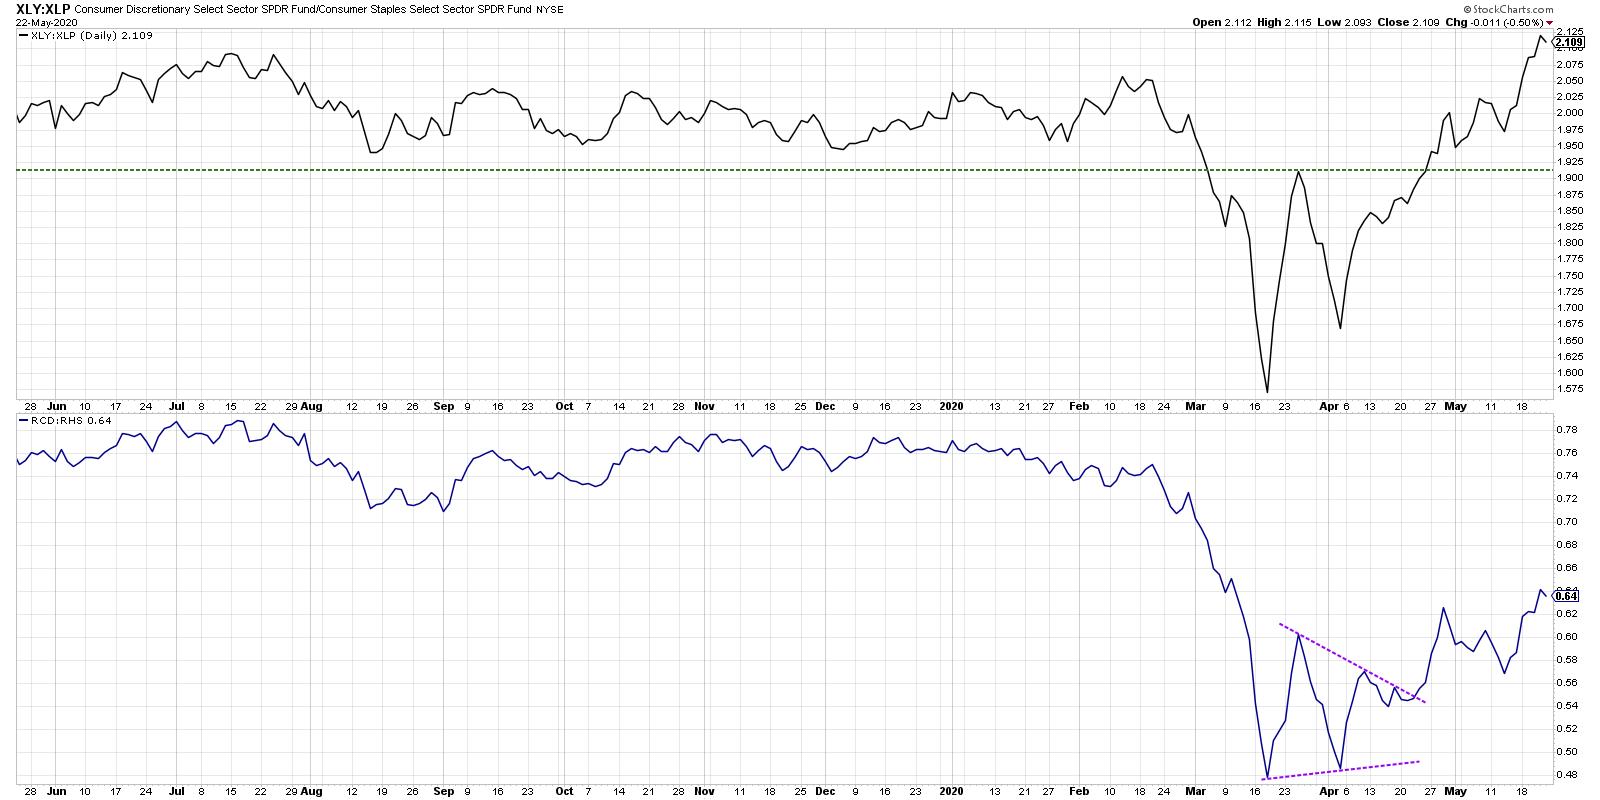
The chart of the XLY drives home the relative outperformance of this traditionally offensive sector, with the relative strength line threatening to find a new 52-week high. It's also important to note that, while the S&P 500 has yet to break above its 200-day moving average, the XLY settled into a range below its 200-day in late April and subsequently broke to new swing high, with a gap higher this week.
While on the surface this all seems very constructive, here are some additional charts to perhaps damper the rampant optimism a bit.
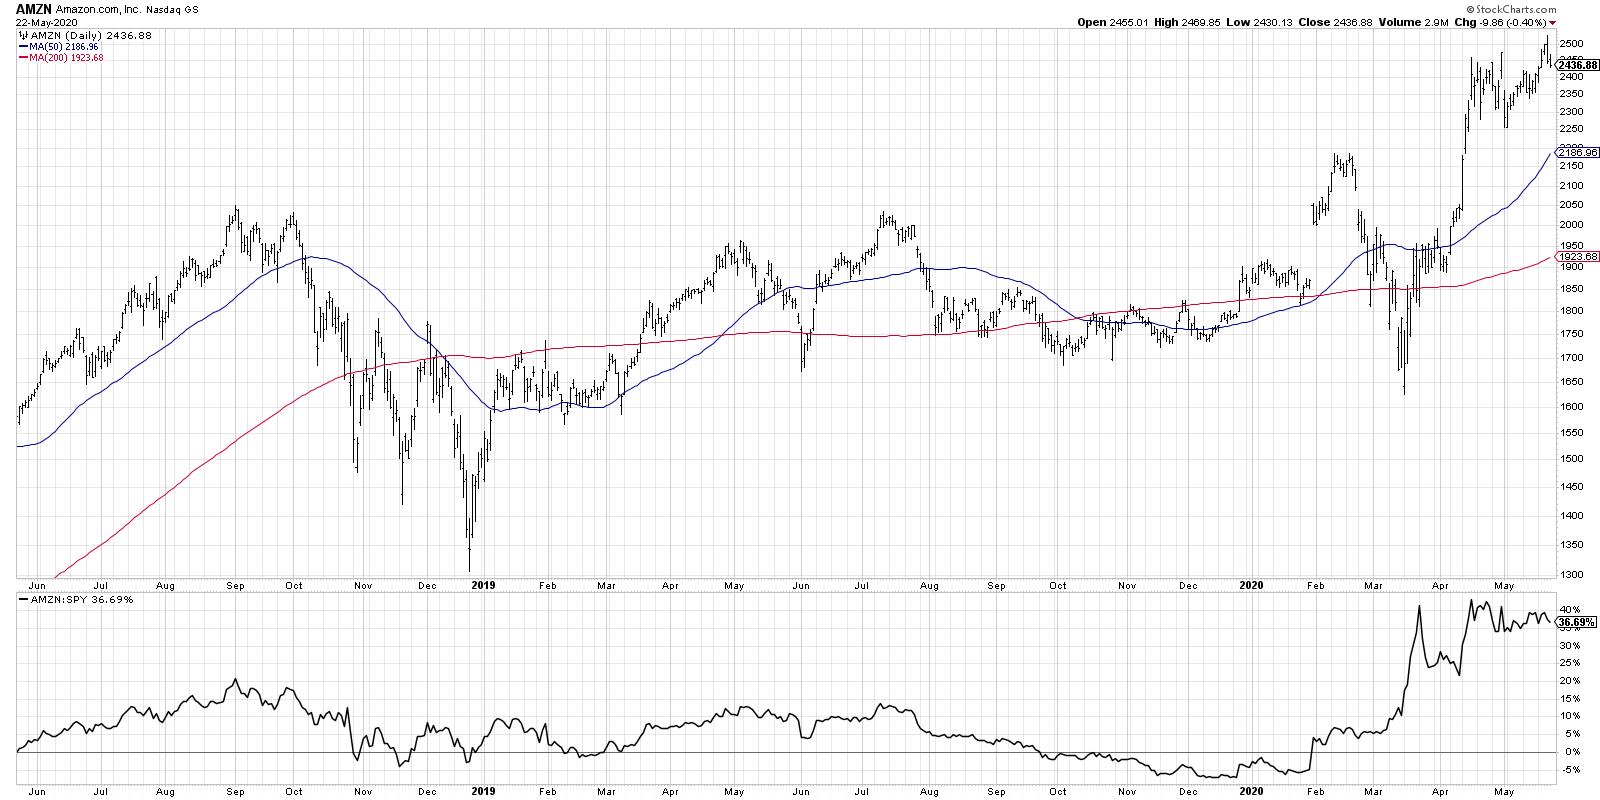
First, Amazon (AMZN) is a huge weight in the Consumer Discretionary ETF, comprising about 24% of the sector. So, when the chart of AMZN looks like this, chances are the sector as a whole will be doing quite well based purely on this one stock.
 Home Depot (HD) is the second largest stock in the sector and makes up another 13% of the weight. So, with that chart also testing new 52-week highs, we have two mega-cap names with outsized weights making outsized gains.
 Second, while the cap-weighted ratio is indeed breaking out, the equal-weighted ratio (using the ETFs RCD and RHS) is well below its 2020 highs. While it is indeed in an uptrend of higher highs and higher lows, it's not as bullishly configured as the cap-weighted version.
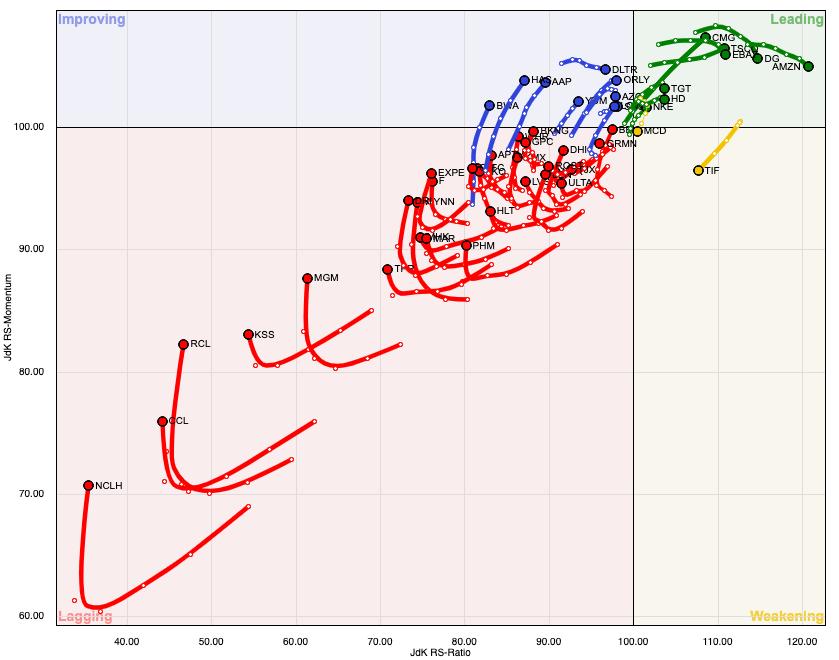
Finally, the Relative Rotation Graph below shows how beaten-down parts of the sector have become. While AMZN appears to be the strongest name according to this methodology, the center point is southwest of the zero line, suggesting the average name has been underperforming the S&P 500. While many of the stocks in the sector have rotated in a more positive direction, much of the sector remains in the Lagging quadrant.
The Consumer Discretionary sector has indeed shown signs of strength at the top level. But an analysis of the stocks that comprise this sector suggest that, without a few key mega-cap names in strong uptrends, the sector may start looking a lot less attractive right about now.
RR#6,
Dave
David Keller, CMT
Chief Market Strategist
StockCharts.com
Disclaimer: This blog is for educational purposes only and should not be construed as financial advice. The ideas and strategies should never be used without first assessing your own personal and financial situation or without consulting a financial professional.
The author does not have a position in mentioned securities at the time of publication. Any opinions expressed herein are solely those of the author and do not in any way represent the views or opinions of any other person or entity.


