March Was a Really Strong Bottom
Tuesday's action looks bullish on the surface, but may signal the end of the rally. I emphasized the word "may" not because I am trying to hedge my bets, but more because the March bottom, by historical standards, was a pretty strong one, likely to hold for a considerable period of time. Indeed, there is a good probability that it will never be taken out. As a result, we have experienced a very powerful rally where short-term bearish technical indicators have been cast aside. To demonstrate what I mean about the power of the rally, take a look at Chart 1, which contains a 10-day MA of the 12-day ROC for the SPX. I have shown this indicator in previous articles. However, I keep going back to it to remind me of the importance of that March bottom. The indicator reached a really deep oversold condition, only seen twice before since the Great Depression. Those examples occurred in 1987 and 2008, indicated in the chart by the two blue arrows. The second point is that this smoothed ROC reached an extreme overbought reading only previously seen at the August 1982, October 2002 and April 2009 bottoms. All instances were followed by very powerful bull markets. The post-1987 advance was not so impressive, but that low has not been seen since.
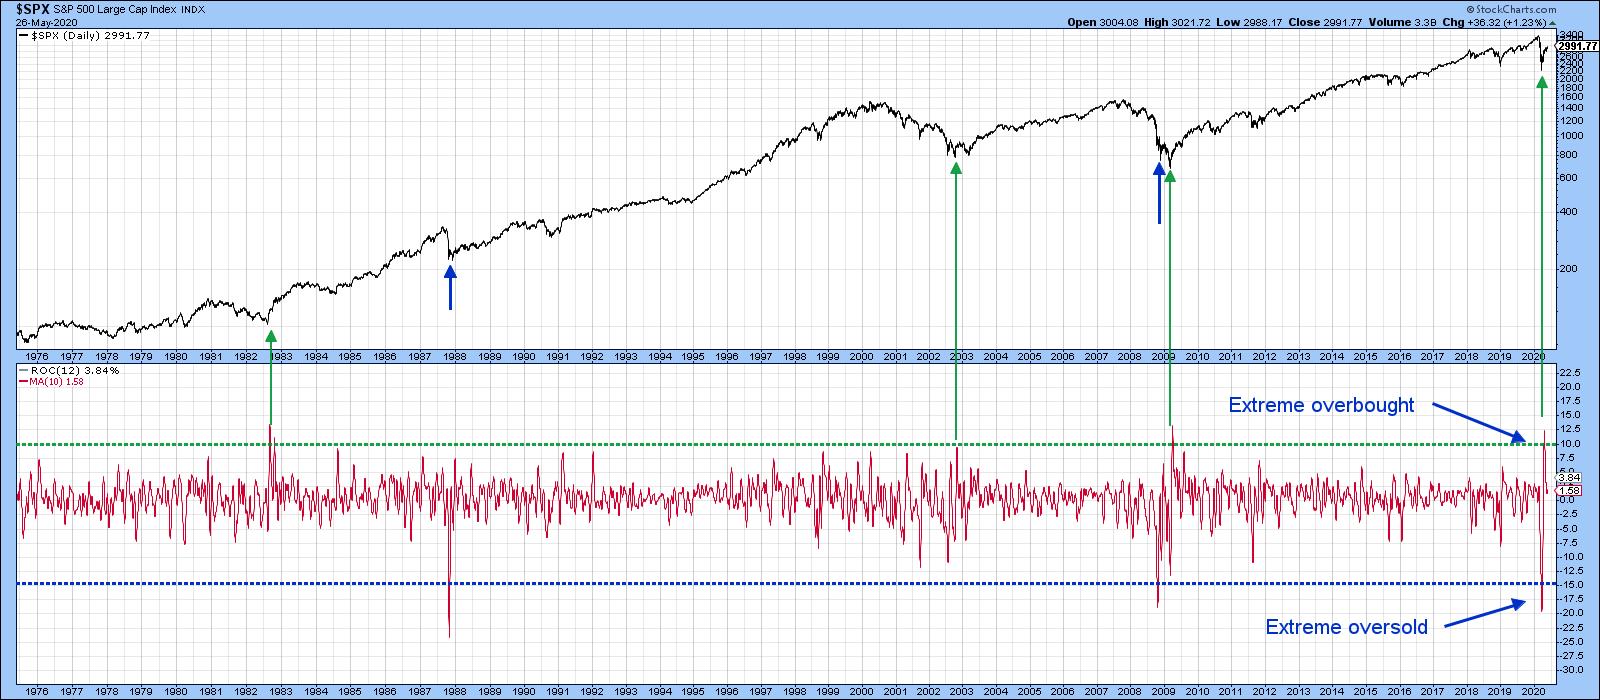 Chart 1
NASDAQ Closes a Gap
Fast-forward to the present and we see that Tuesday's action leaves a lot to be desired. Let's take the NASDAQ first. Chart 2 shows that it opened on its high, just at the upper area of its March downside gap. That gap was bullish in the sense that gaps are almost always filled, as investors and traders typically come back and revisit their emotions. Since that chart vacuum has now been closed, market participants have fulfilled those obligations. Second, Tuesday's Index action represented a key reversal day. That refers to a day in which buyers come into the session with great enthusiasm as the price opens up with a gap, but, by the end of the day, prices reverse to the downside and end it pretty well where the previous session closed. As a general rule, the longer and sharper the preceding advance, the stronger the pattern. Note the three gaps that were formed lower down. There is no guarantee that any of them will be filled, but that's still a worry going forward.
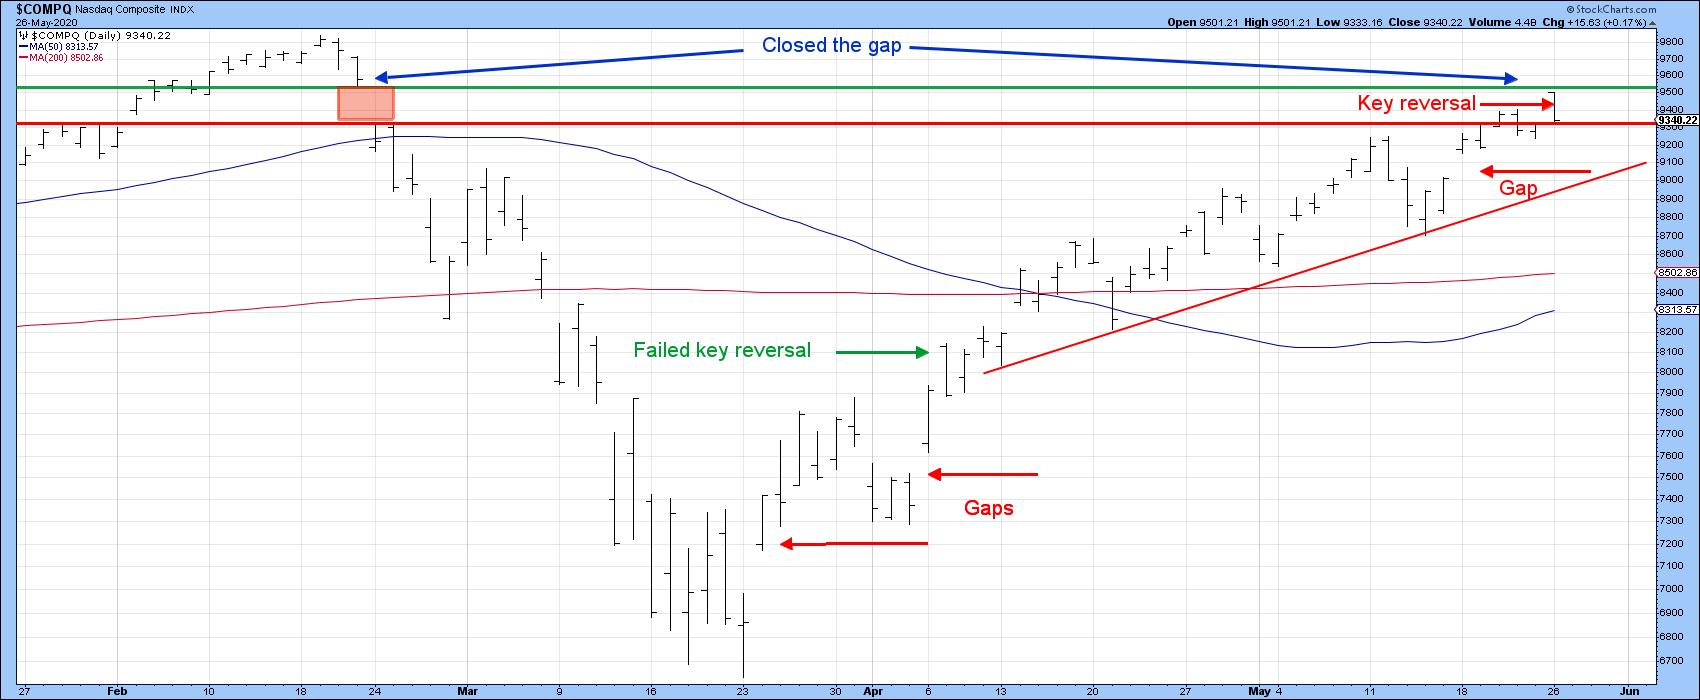 Chart 2
That said, a bearish pattern in a bull market often fails to fulfill its negative promise, as you can see from the early April key reversal flagged by the green arrow. I cited that one as a bearish factor at the time and got my head handed to me on a platter, as it was quickly followed by new highs. The same could happen in the current situation, but I think it's less likely, as the NASDAQ bullish percent (Chart 3) has been noticeably weak in recent weeks, having twice failed to confirm new highs in the Index itself. There is nothing to preclude a third or even fourth negative divergence from developing, but the history of the four previous ones shows that, when the up trendline in the NASDAQ is violated, bad things can happen.
The line I would use in the current situation is shown in Chart 3. It is currently around 8,900 and rising pretty rapidly.
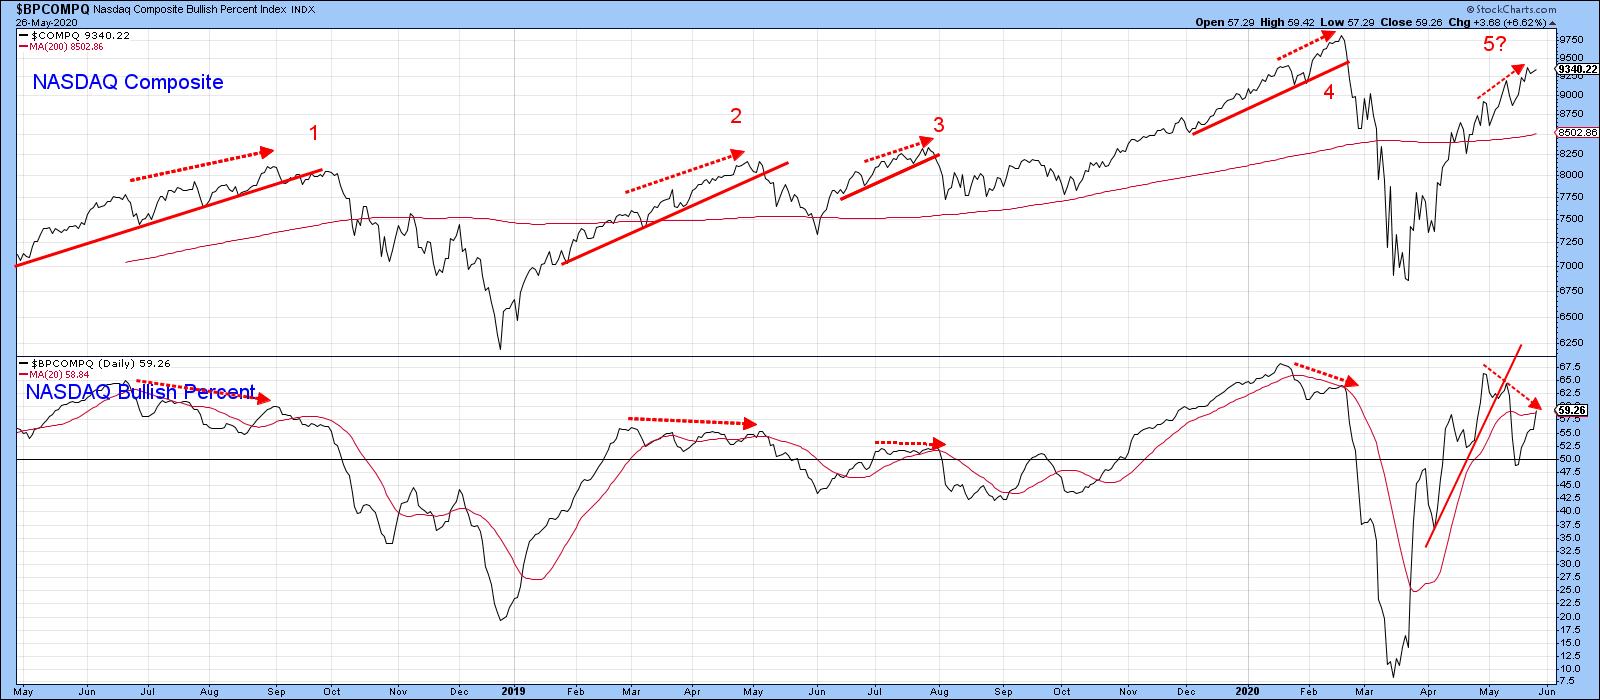 Chart 3
Finally on the NASDAQ, Chart 4 shows that its RS line against the S&P experienced a trendline break on Tuesday. Since the KST has also started to roll over, this may indicate that Wall Street's favorite stocks are in for a bumpy ride. The KST for the absolute price has already gone negative, which places that up trendline in Chart 4 in danger of being ruptured.
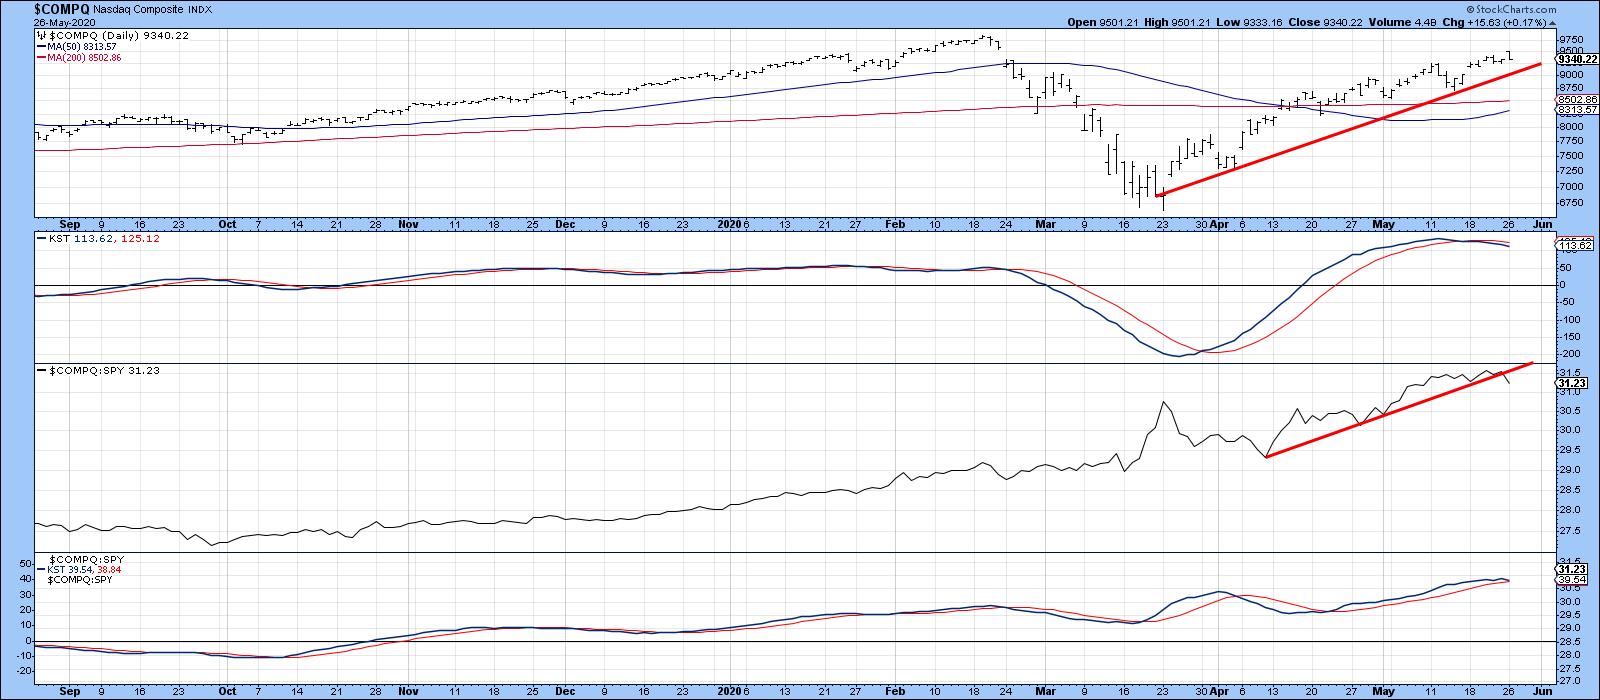 Chart 4
To sum up, a very strong technical bottom was registered during the end of March/early April period. Its positive effects are likely to be felt for a long time. However, there are several indicators that suggest that, if a correction is going to take place, now might be as good a time as any to expect it.
Editor's Note: This is an excerpt of an article that was originally published in Martin Pring's Market Roundup on Tuesday, May 26th at 7:18pm ET. Click here to read the full article, which includes Charts 5-6 and a discussion of the S&P.
Good luck and good charting,
Martin J. Pring
The views expressed in this article are those of the author and do not necessarily reflect the position or opinion of Pring Turner Capital Group of Walnut Creek or its affiliates.
