The simple answer to the question posed in the title is "No!". However, there are a number of interesting parallels that have implications for 2020 and beyond. Let's see what they are.
The Decennial Cycle and Years Ending in a "0"
According to the decennial cycle, first espoused by Edgar Lawrence Smith in his 1920s best seller Tides in the Affaires of Man, years ending in a specific digit experience a similar outcome. In my book Technical Analysis Explained, I averaged out the decennial cycle from 1900-2009 using a 12-month ROC as a guide. Years ending in a zero, which applies to both 1980 and 2020, experienced a peak at the start of the year, followed by a selloff mid-year and a strong rally into year-end. This year-end advance took the ROC back to its starting point. The green shading in Chart 1 shows that the 1980 experience followed the average pattern pretty closely. The major difference was that the ROC ended 1980 not at, but well above its starting point.
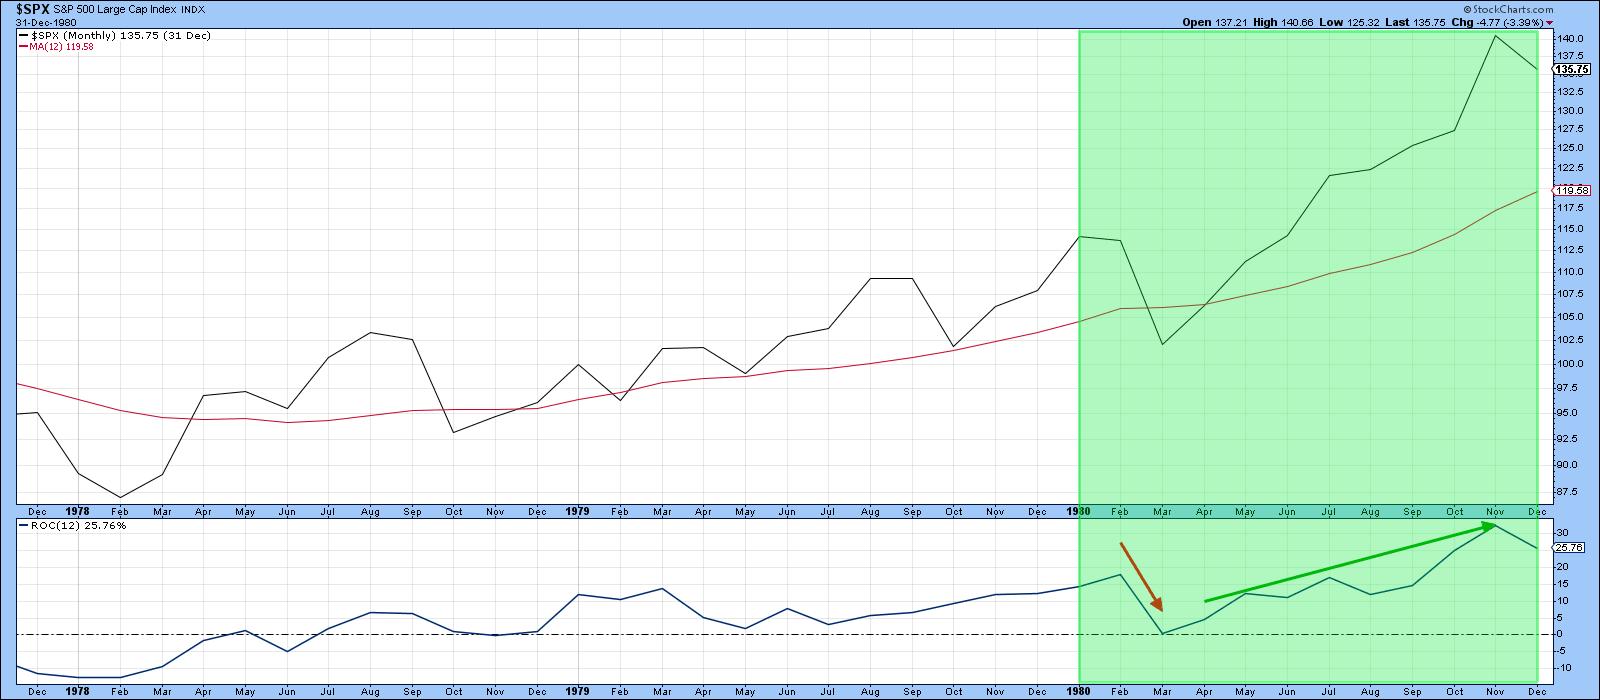 Chart 1
Chart 2 shows 2020 to date. A decline earlier in the year has been followed by a rally. So far, so good. We don't know where the year will end up, of course, but, in last week's article Market Action Confirms the Employment Report, I pointed out that several indicators had reached the kind of extreme level typical of the early phase of a primary bull market. Such readings have therefore signaled that a major advance is to follow. Should that analysis turn out to be correct for the current situation, the S&P will end the year higher than it started, thereby repeating Smith's decennial pattern for years ending in a zero.
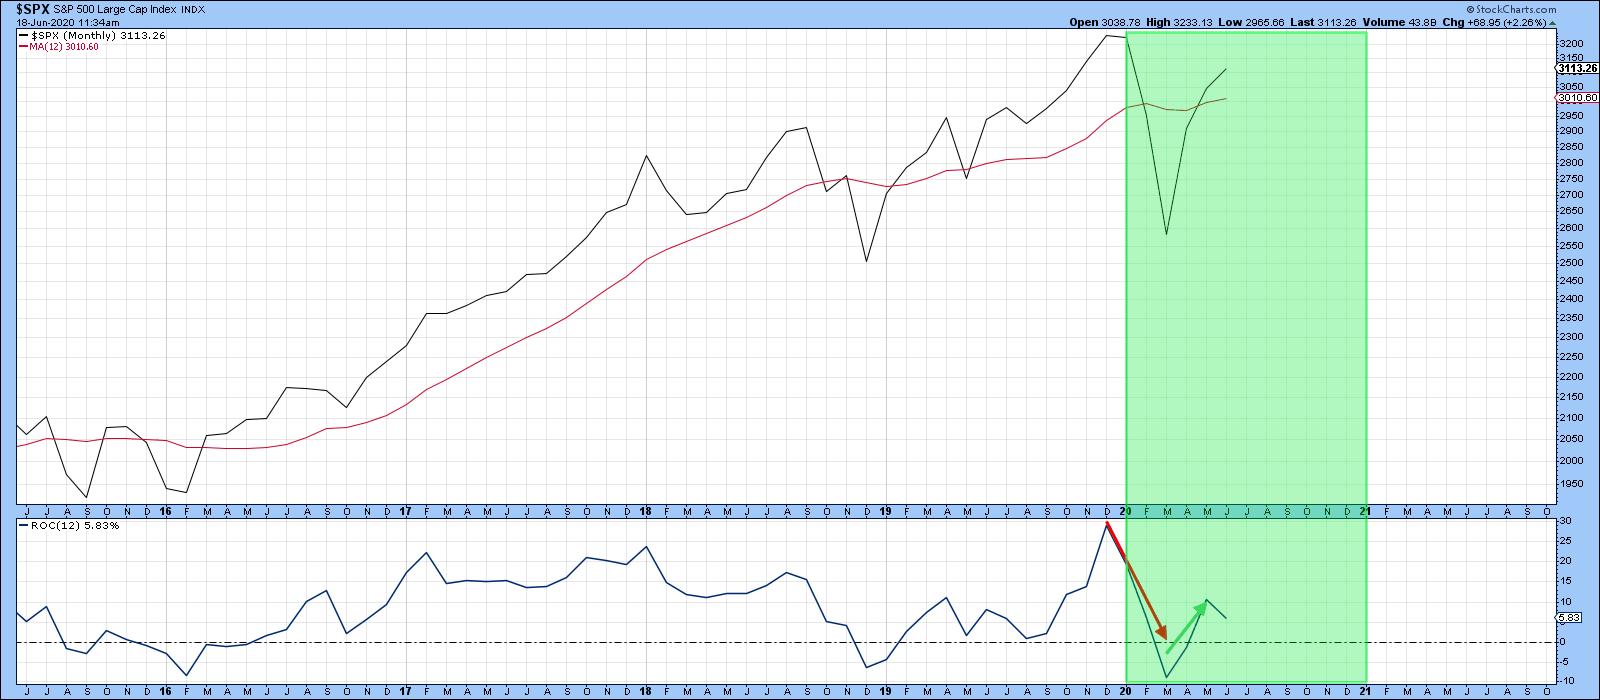 Chart 2
Nineteen-Eighty and Twenty-Twenty Both Experienced Recessions
In 1980, the economy peaked in February (sound familiar?) and the contraction was over by July. An interesting parallel is that both the 1980 and current recessions were brought on by artificial means. The 1980 example was caused by Fed actions that deliberately raised rates in order to curb rampant inflation. The economy quickly responded by weakening. Then, policy reversed on a dime, causing rates to drop sharply and by late summer the economy started to grow again.
The current recession has also been triggered artificially, this time by the pandemic lockdown. It seems likely to end just as quickly as the country gradually reopens. The positive May jobs report and this week's surprising jump in retail sales testify to that probability.
Further Out, Things are More Problematic
Things may look positive from here on out. However, the sharp recent drop in the economy has not come without a long-term cost. Chart 3 features Industrial Production, a coincident indicator of the economy, together with its KST. Note that in 1980 it was possible to construct an up trendline, which was subsequently violated. This break in trend was not sufficient to stop an initial sharp rebound. However, the evident loss of long-term momentum did preclude the indicator from surpassing its January 1980 peak. It was not until until the recession of 1981-82 had run its course that it did. Clearly, the 1980 trendline violation had implications for the subsequent weak recovery and the double dip recession. The chart shows two other trendline penetrations, none of which were followed by new highs in the production numbers for some time.
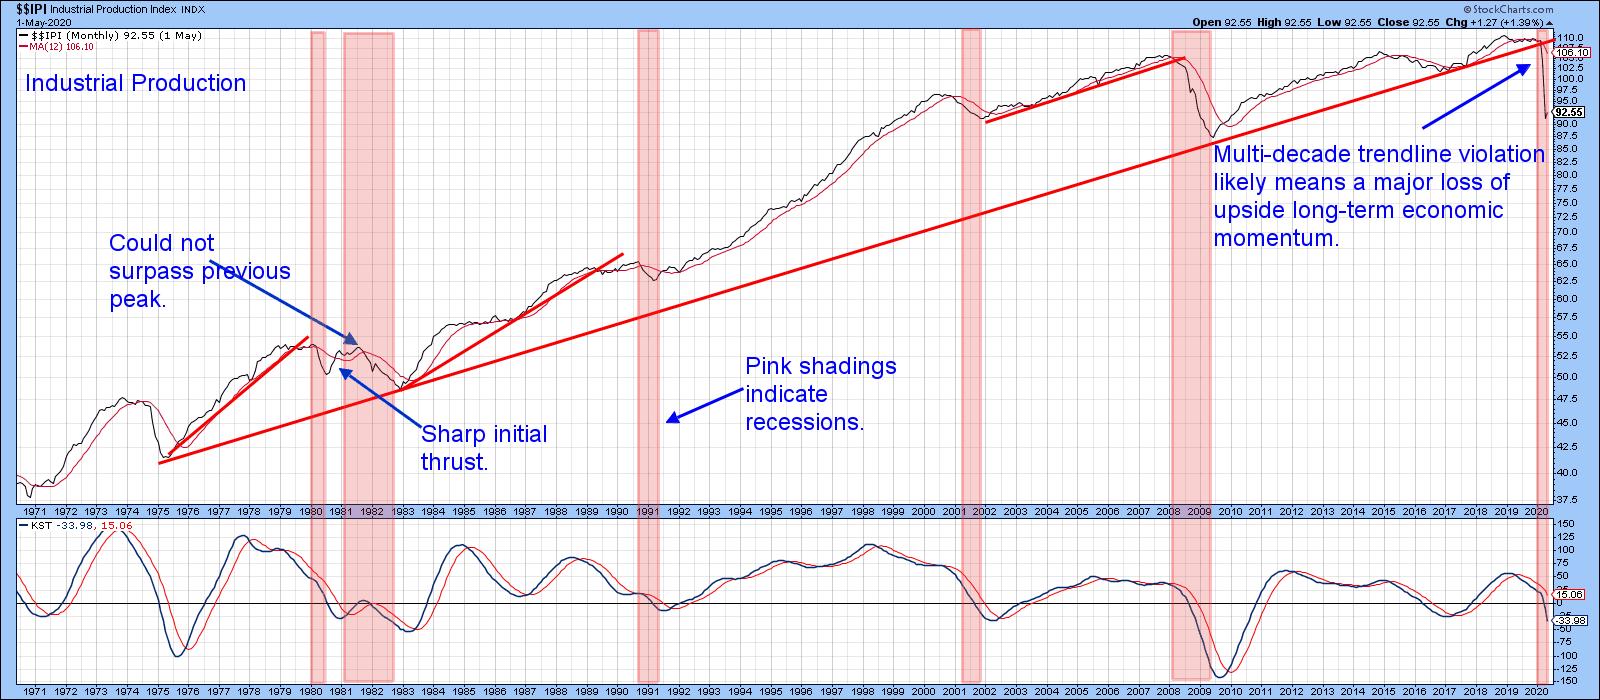 Chart 3
Earlier this year, we saw the violation of a much more significant multi-decade trendline. That break also underscores the likelihood of a loss of long-term economic momentum. The implication is that another slowdown or recession could be lurking once the initial bounce has run its course. Remember, the 1980-82 period was a transitional one as the secular bull market for both commodities and interest rates peaked. Perhaps the recent trendline violation is warning us that another restructuring period lies ahead. There are no shortages of possibilities. For example, it could reflect the disruptive effects of a transition to home-based work, learning and conferencing. Alternatively, after nearly 40 years of declining interest rates, perhaps it's time for a reversal to the upside.
In the interim, the 1980s sharp post-recession equity rebound to significant new highs sets an aspirational goal for the balance of 2020.
Editor's Note: This is an excerpt of an article that was originally published in Martin Pring's Market Roundup on Thursday, June 18th at 1:28pm ET. Click here to read the full article, which includes Charts 4-5 and a discussion of the Invesco China Technology ETF.
Good luck and good charting,
Martin J. Pring
The views expressed in this article are those of the author and do not necessarily reflect the position or opinion of Pring Turner Capital Group of Walnut Creek or its affiliates.


