 The 200-day SMA is a long-term trend indicator that chartists can use across the equal-weight sectors to measure the balance of power in the broader market. The more sectors trading above their 200-day SMAs, the more bullish the market. The more sectors trading below their 200-day SMAs, the more bearish the market.
Today I am going to use the eleven equal-weight sector ETFs and put them into two groups. The first group (6) contains the five biggest sectors and the five offensive sectors. Healthcare is the fourth biggest sector, but it is not part of the offensive group. Communication Services is part of the offensive group, but is actually the smallest sector in the equal-weight S&P 500. Industrials, Technology, Finance and Consumer Discretionary are the other offensive sectors. They are "offensive" because these are the sectors we want to see leading during a broad market advance.
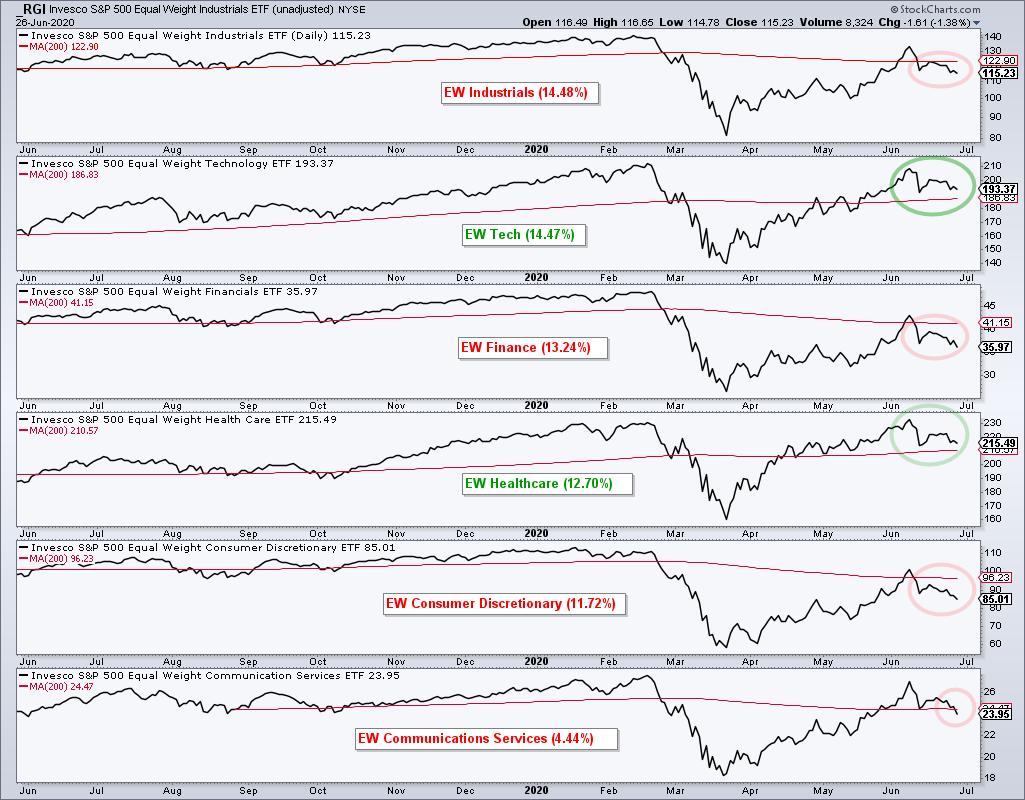
The chart above shows each of these sectors with their 200-day SMAs and the sector weighting. The sector name is red if below the 200-day and green if above. Currently, four of the five offensive sectors are below their 200-day SMAs and four of the five largest sectors are below their 200-day SMAs. This is not what we would expect to see in a bull market. Also notice that not one of these sectors recorded a new high in June. All fell short of their February highs.
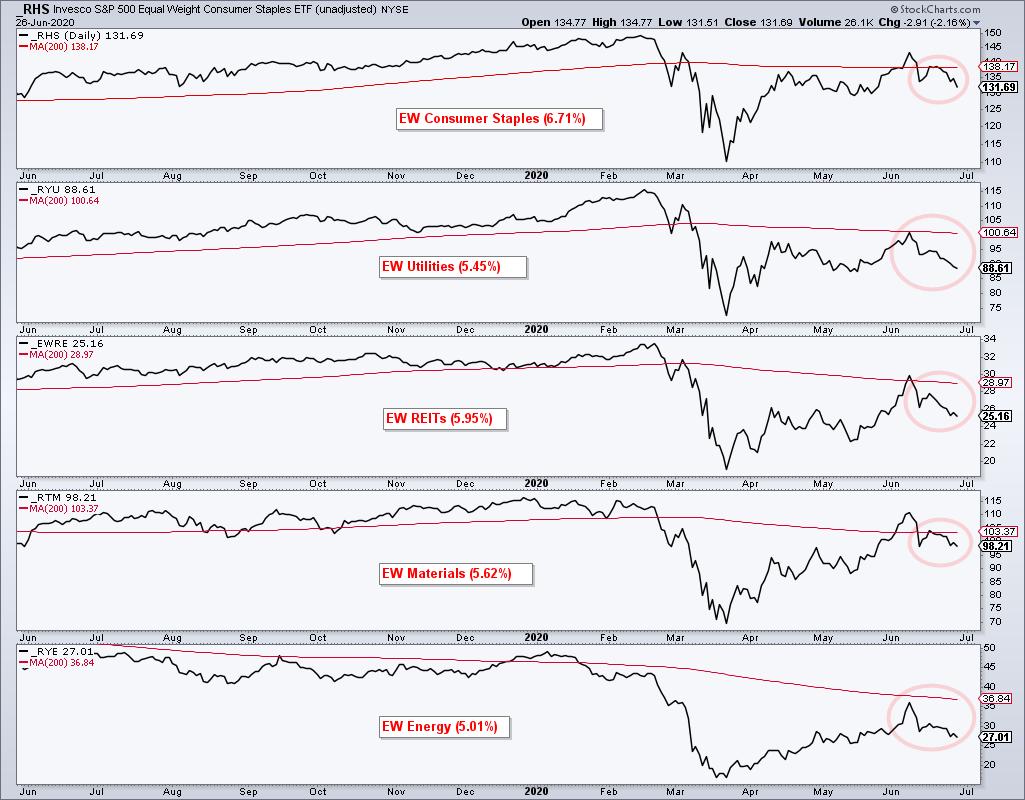
The picture deteriorates even further when we look at the defensive sectors, Materials and Energy. All five are below their 200-day SMAs. Utilities and Energy did not even get back above their 200-day SMAs in June.
Looking at the eleven sectors overall, the picture is clearly not bullish. Nine of eleven are below their 200-day SMAs. The Technology and Healthcare sectors are the only two above their 200-day SMAs and they are the leaders. Even though tech is an important sector, I do not see how we can call this a bull market when nine sectors are below their 200-day SMAs and not one hit a new high in June.
This week on TrendInvestorPro I examined the dud bottle rocket candlestick in SPY, the bearish failure swing in QQQ and the bearish wedge in IWM. In addition, I updated breadth models for the $NDX, $SPX, $MID and $SML. Subscribers who are StockCharts members also receive the core and master ETF chartlist and the essential breadth indicator chartlist. Note that I am on vacation the second week of July (5-11) and there will not be any reports that week.
Click here to take your analysis to the next level!
------------------------------------
Choose a Strategy, Develop a Plan and Follow a Process
Arthur Hill, CMT
Chief Technical Strategist, TrendInvestorPro.com
Author, Define the Trend and Trade the Trend
Want to stay up to date with Arthur's latest market insights?
– Follow @ArthurHill on Twitter


