Technology About to Pause?
The undisputed king of sectors so far this year has been technology. This week's price action from the tech dominated NASDAQ Composite ($COMPQ), though, suggests that this leadership may be rotating elsewhere. Take Chart 1, for instance; it shows that Monday's price action took the form of a bearish outside day and that the latest high was not confirmed by either the RSI or the PVO. These are not earth-shattering developments, but do hint at a possible pause in the advance.
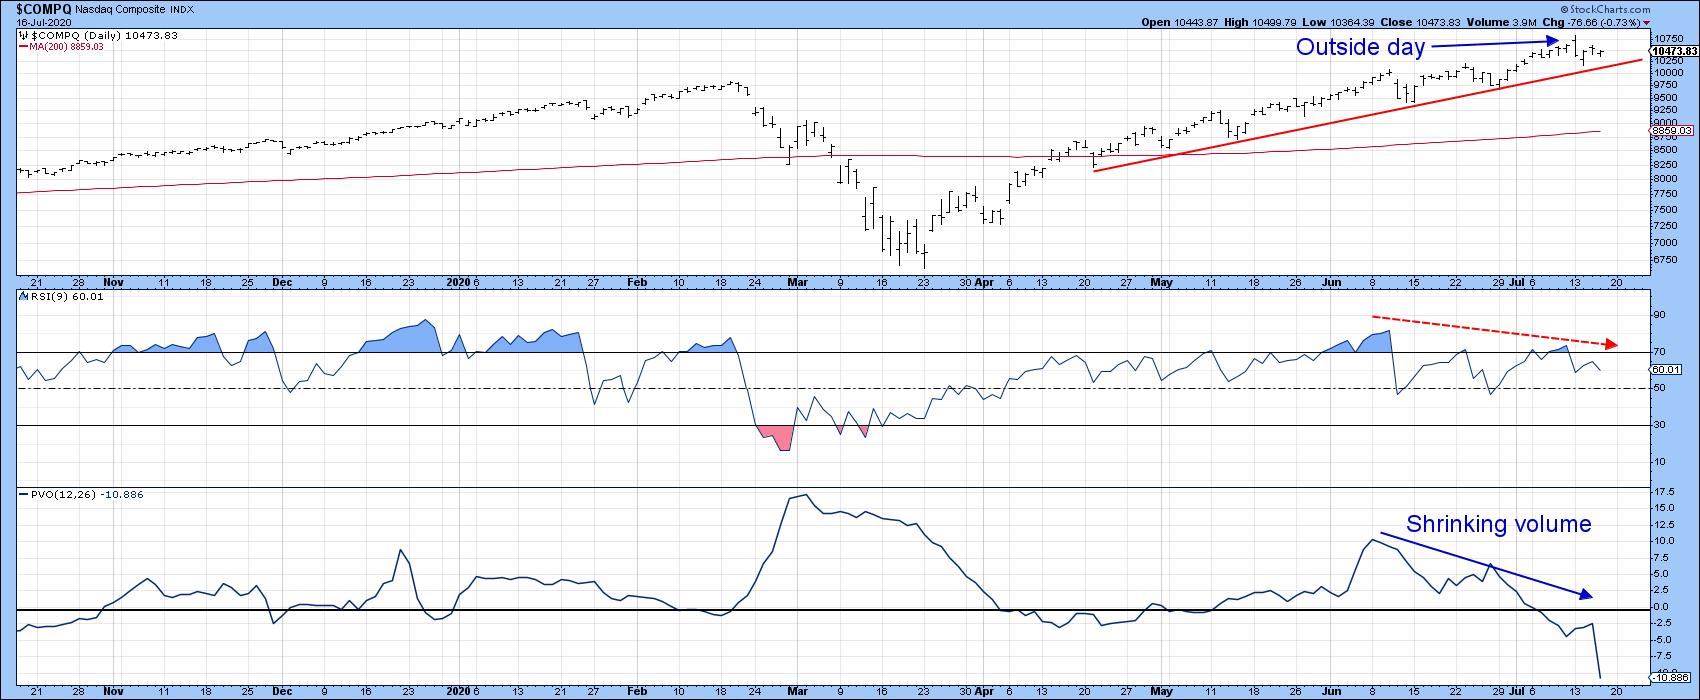 Chart 1
Chart 2 tells us that both the price and RS line for the SPDR Technology (XLK) are very close to their April/July up trendlines. Note that the KST for relative action (in the bottom window) has just triggered a sell signal, again hinting at a possible forthcoming period of underperformance.
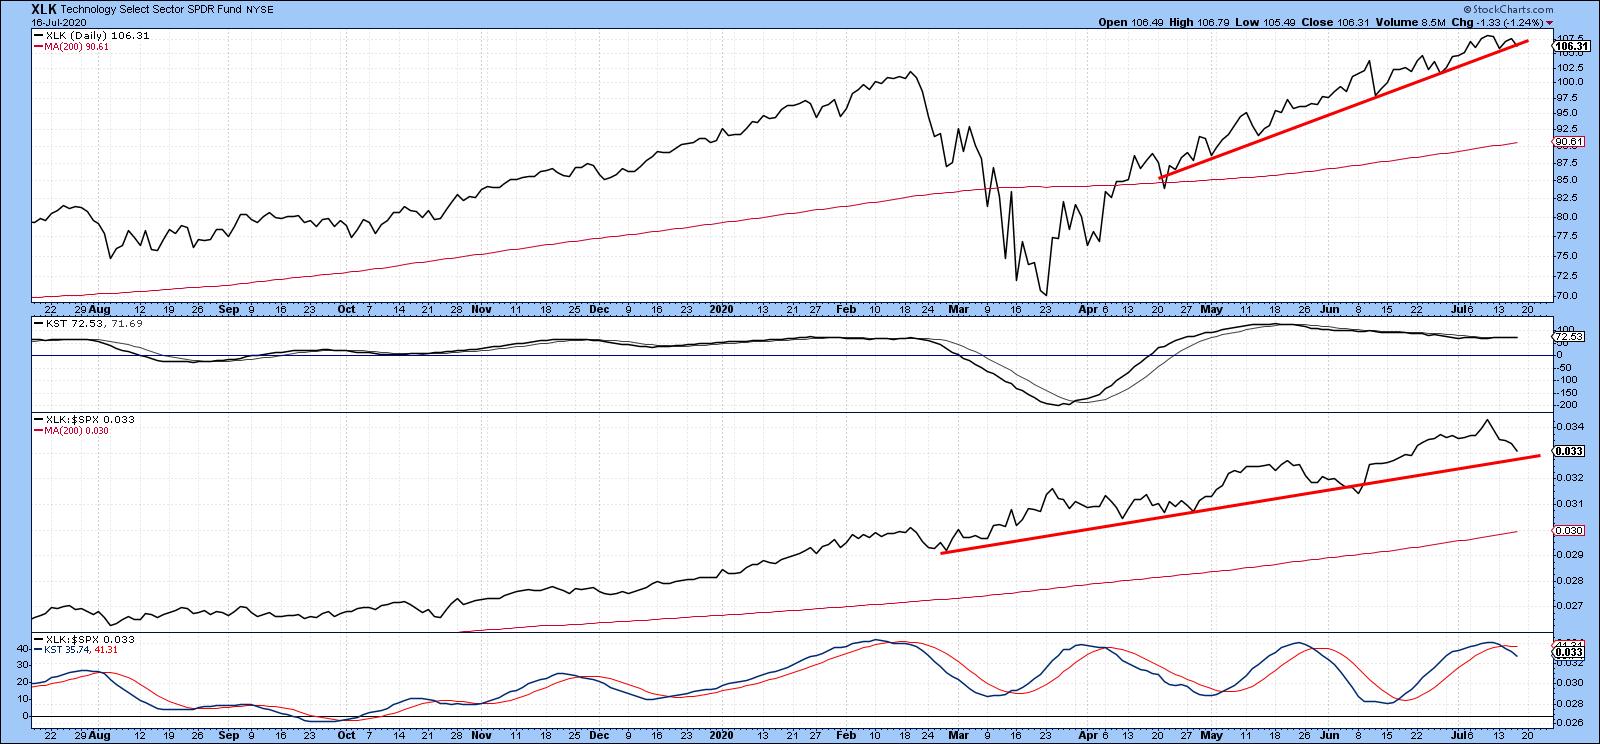 Chart 2
Finally, Chart 3 tells us that the recent NASDAQ advance was associated with a declining bullish percentage. This indicator is currently below its 20-day MA and the April/June up trendline. Previous example of negative divergences have been flagged with the arrows. The missing ingredient for the current setup lies in the fact that the Index has yet to rupture its April/July up trendline.
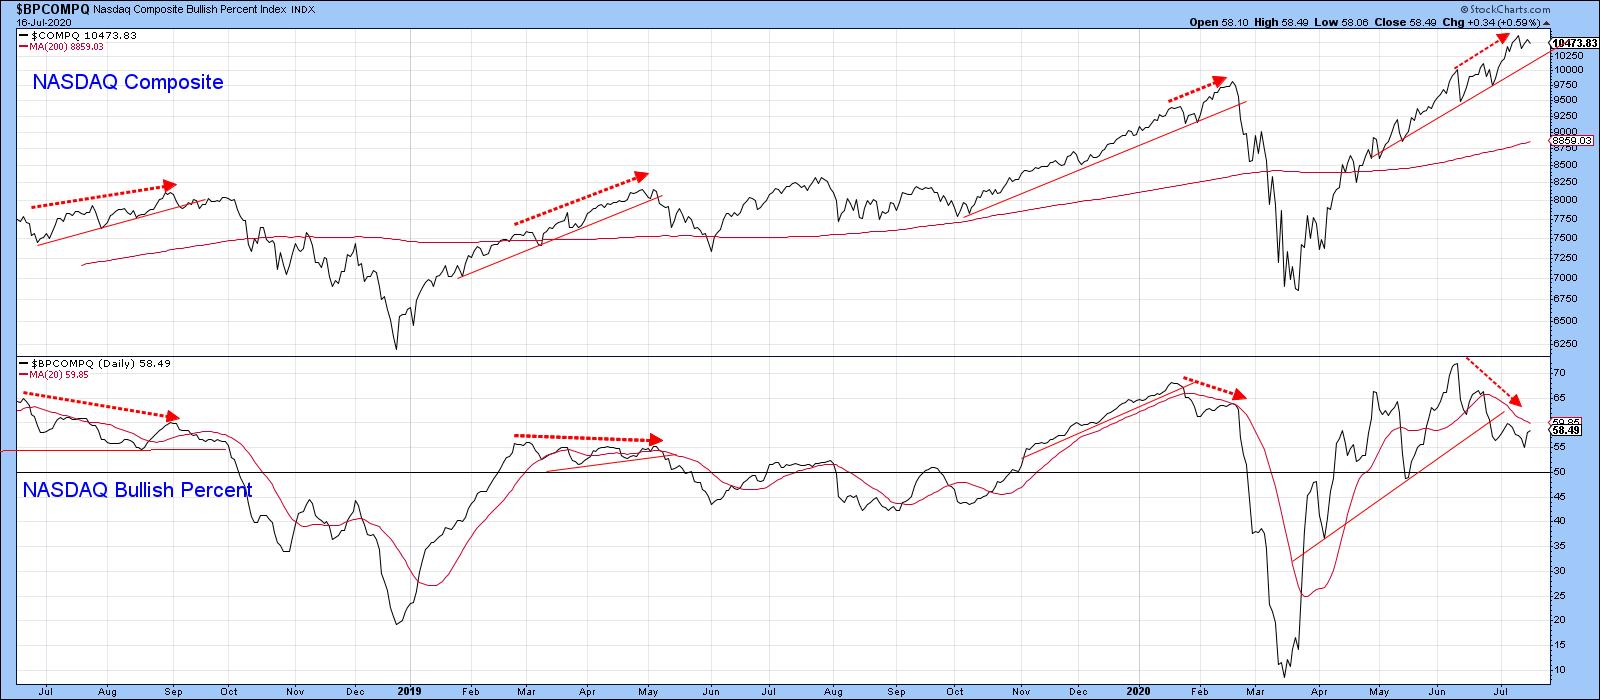 Chart 3
I want to stress that none of the trendlines for the Index in any of these charts have yet been violated, so it is premature to take a bearish stance. After all, as I alluded to in my mid-year outlook, we need to focus on the long-term indicators, the majority of which are signaling a primary bull market, rather than worrying about counter-cyclical price movements that may or may not develop.
New Blood is Starting to Emerge
In a primary bull market, leadership often rotates between the various sectors as the mood shifts from liquidity-driven and defensive issues to earnings-driven and commodity-sensitive ones. Such switching is typically caused by an economy transitioning to a more mature state, as characterized by capacity restraints and so forth. We are not at that stage yet, as the current recovery is at a very early phase. Indeed, if there is a pattern, it is a changeover to early cycle leaders instead. The beneficiaries are staples, consumer cyclicals, healthcare and transports, as featured in Charts 4, 5, 6 and 7. Consumer Staples, in Chart 4, have just broken out above two trendlines and are being accompanied by the daily KST. The KST for relative action, in the bottom window, is also bullish and is suggesting that the RSI will soon break above its May/July resistance trendline.
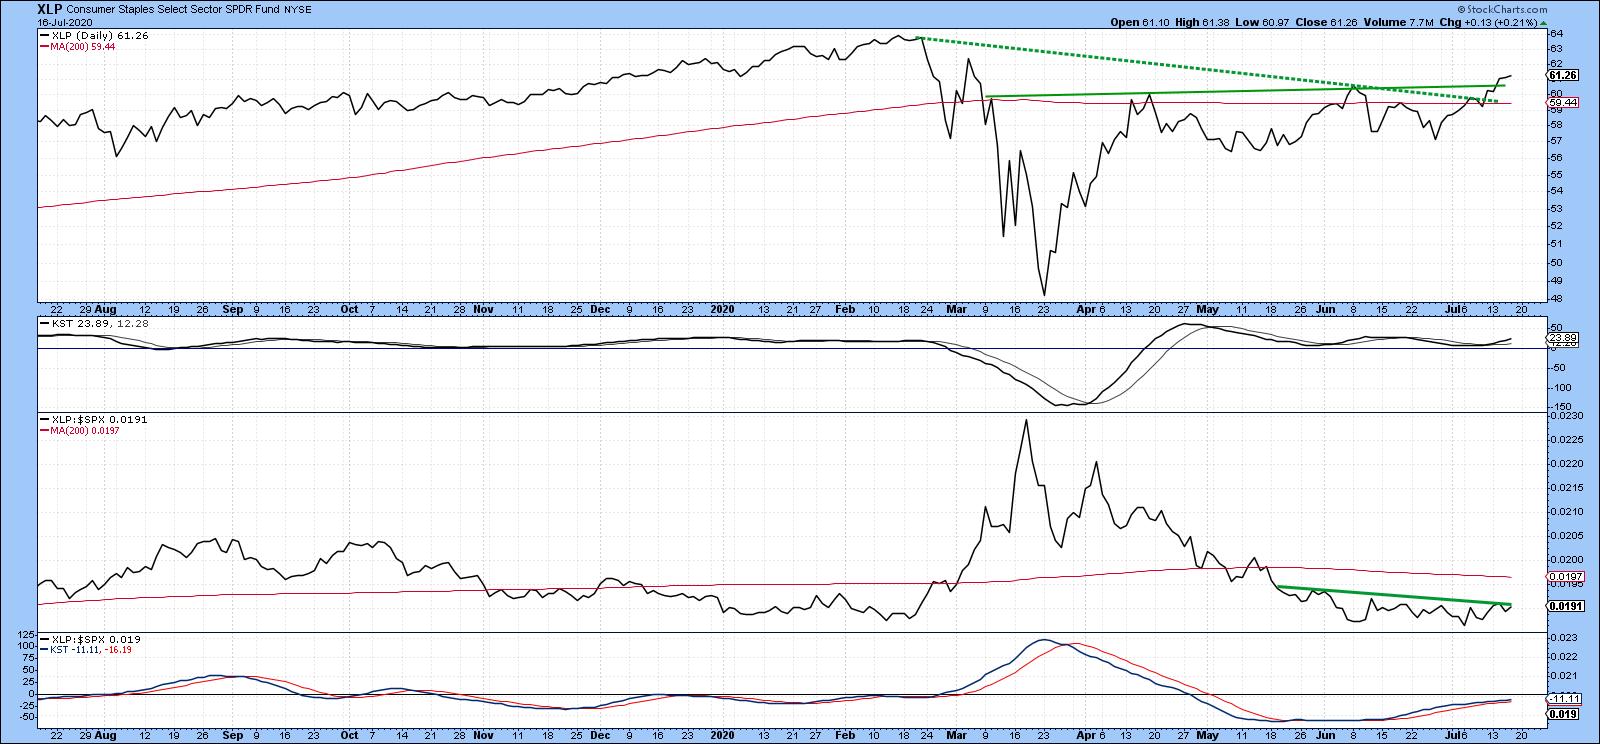 Chart 4
Consumer cyclicals have experienced a nice breakout to a post-pandemic high alongside the RS line. The two KSTs are bullish but are clearly finely balanced at this point. It's absolutely imperative that the price hold above the extended green breakout trendline. If not, that would indicate an invalid breakout, which would open up the potential for a nasty decline.
 Chart 5
Relative action for healthcare is in a similar mode to staples, in that it is right at a resistance trendline with a positive KST. The price itself appears to be breaking out from a consolidation inverse head-and-shoulders. The positive KST action suggests that it will be able to experience a more decisive breakout. That said, it would not be a good thing if the breakout fails, as this would reverse the upward trajectory of the KST. Momentum reversals at new price highs that take place from at or slightly above the equilibrium level are often followed by an above-average decline.
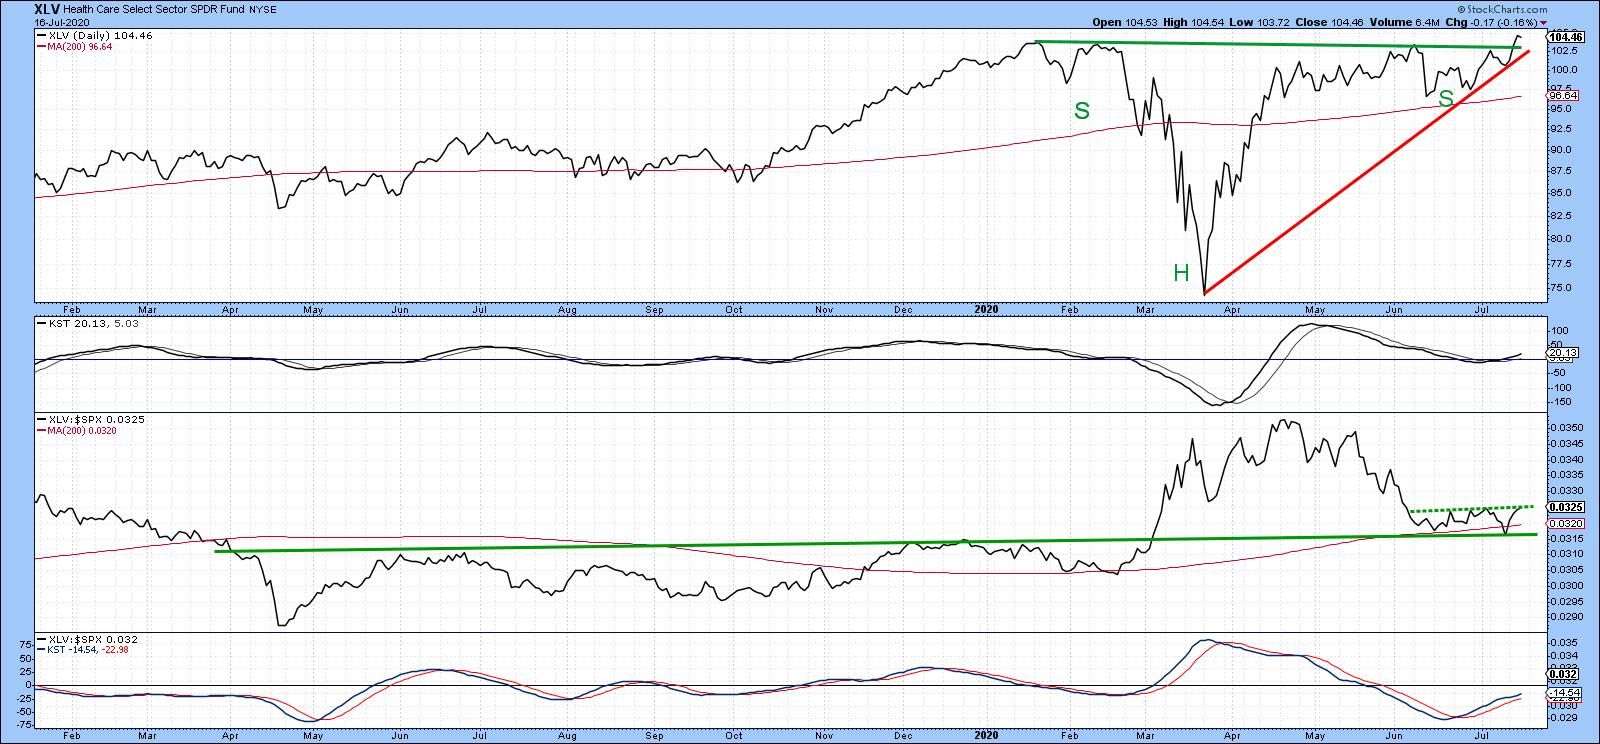 Chart 6
Transports are not a defensive sector, but often move early in the cycle. We can see in Chart 7 that the Dow Jones Transportation ETF (IYT) has tentatively cleared its 200-day MA and the February/July resistance trendline. This action is also being supported by the RS line, which is trying to poke its head above a longer down trendline emanating from last November. The RS KST has also gone tentatively bullish.
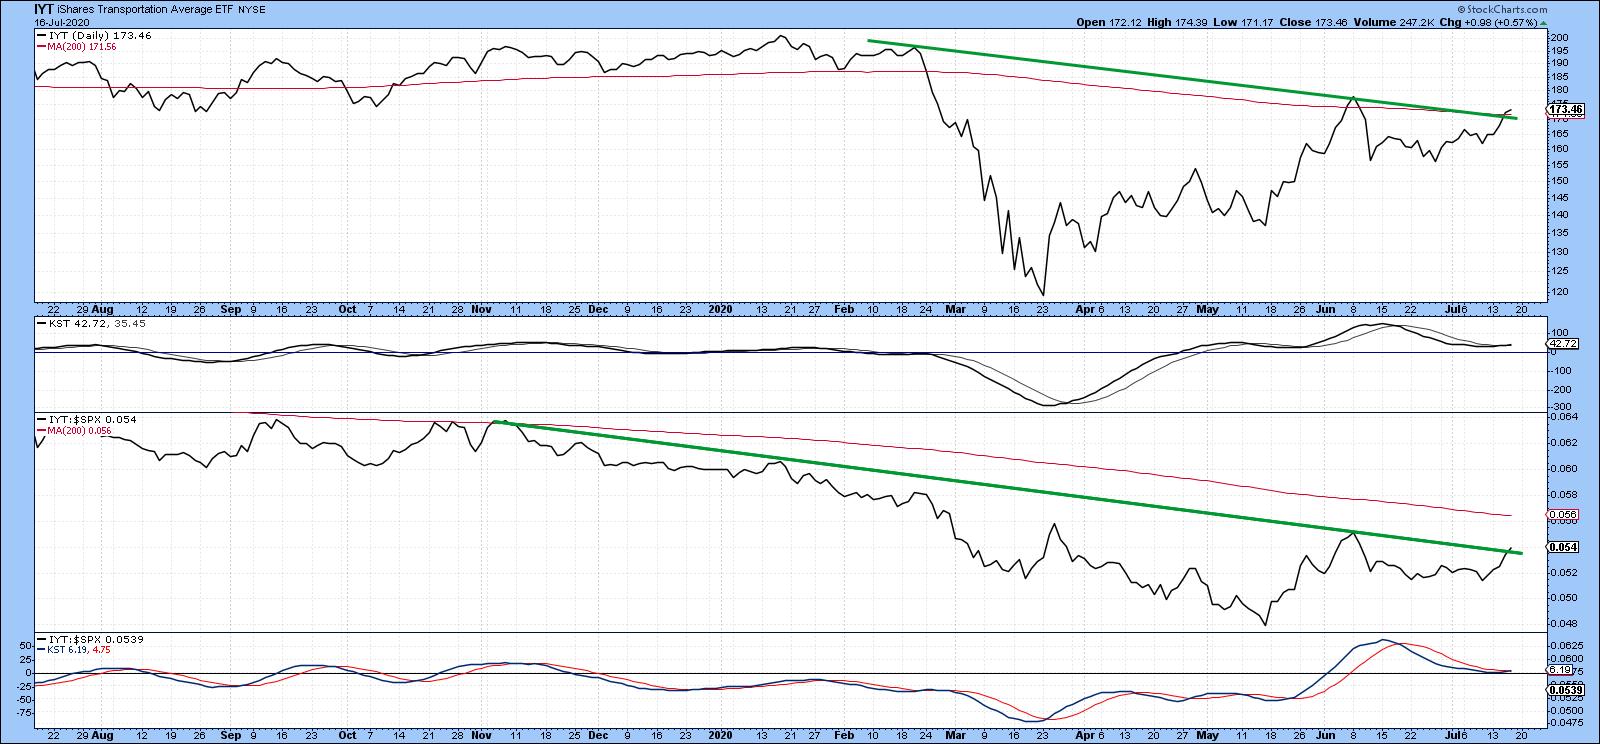 Chart 7
Chart 8 features the SPDR Materials ETF (XLB). This sector, which includes mining and basic industries, tends to do better at the tail end of the cycle. However, you can see that it is currently one of the stronger brethren, as both the price and RS have moved through important resistance accompanied by two positive KSTs.
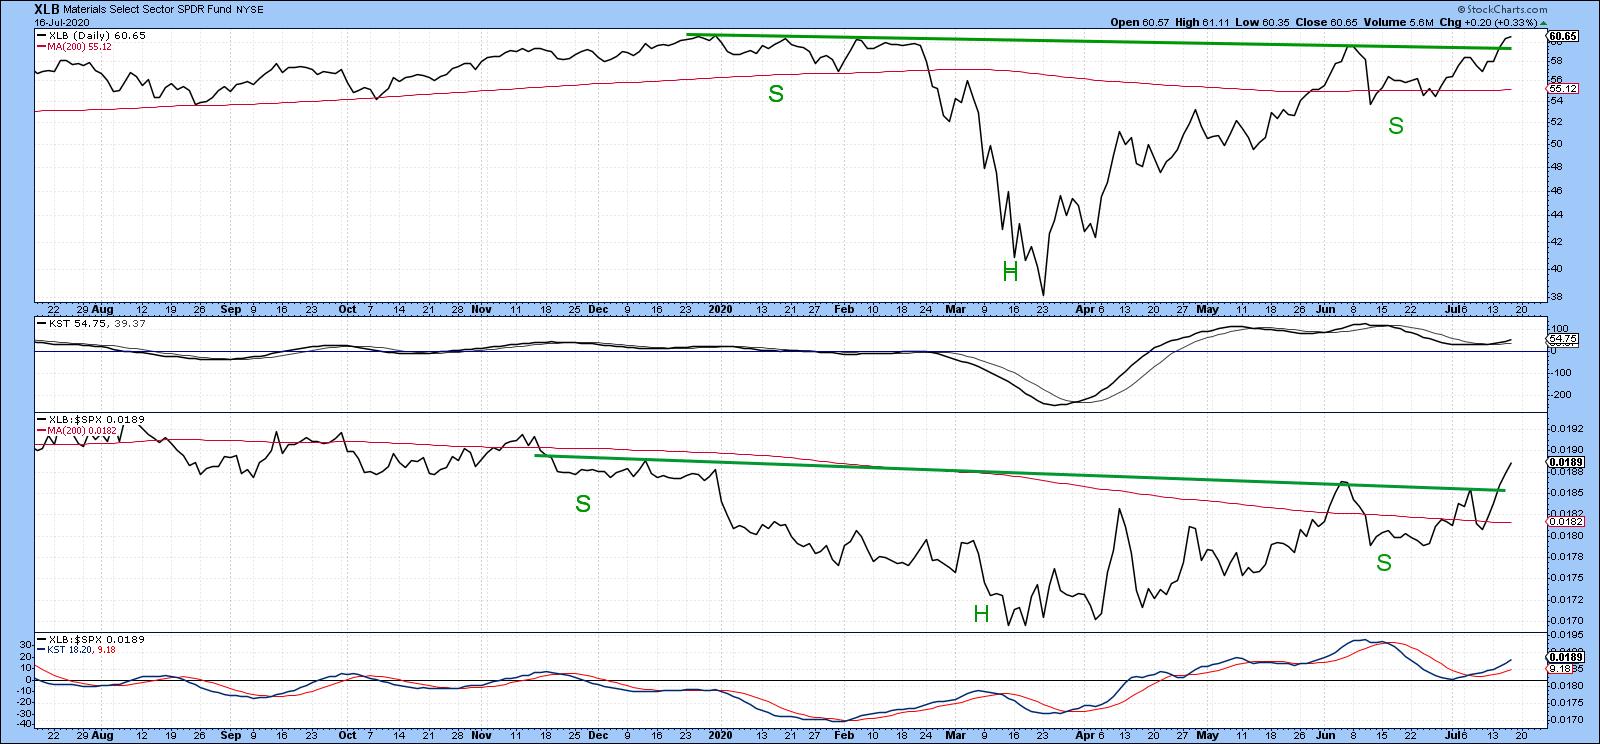 Chart 8
Editor's Note: This is an excerpt of an article that was originally published in Martin Pring's Market Roundup on Thursday, July 16th at 5:03pm ET. Click here to read the full article, which includes Charts 9-10 and a discussion of Industrials (IYJ) and Financials (XLF).
Good luck and good charting,
Martin J. Pring
The views expressed in this article are those of the author and do not necessarily reflect the position or opinion of Pring Turner Capital Group of Walnut Creek or its affiliates.


