This week on The Final Bar, one of our Mailbag questions related to Amazon.com (AMZN) and how far it has reached above its 200-day moving average. This phenomenon speaks to the long-term strength of AMZN's price movements, the short-term overreaching of the price since the March market low and the high likelihood of further upside for the stock.
I always tell people that there are three trends to concern yourself with: the trend you're trading, the longer-term trend one level above your time frame and the shorter-term trend one level below your time frame.
I developed this crude PowerPoint image to illustrate these three cycles.
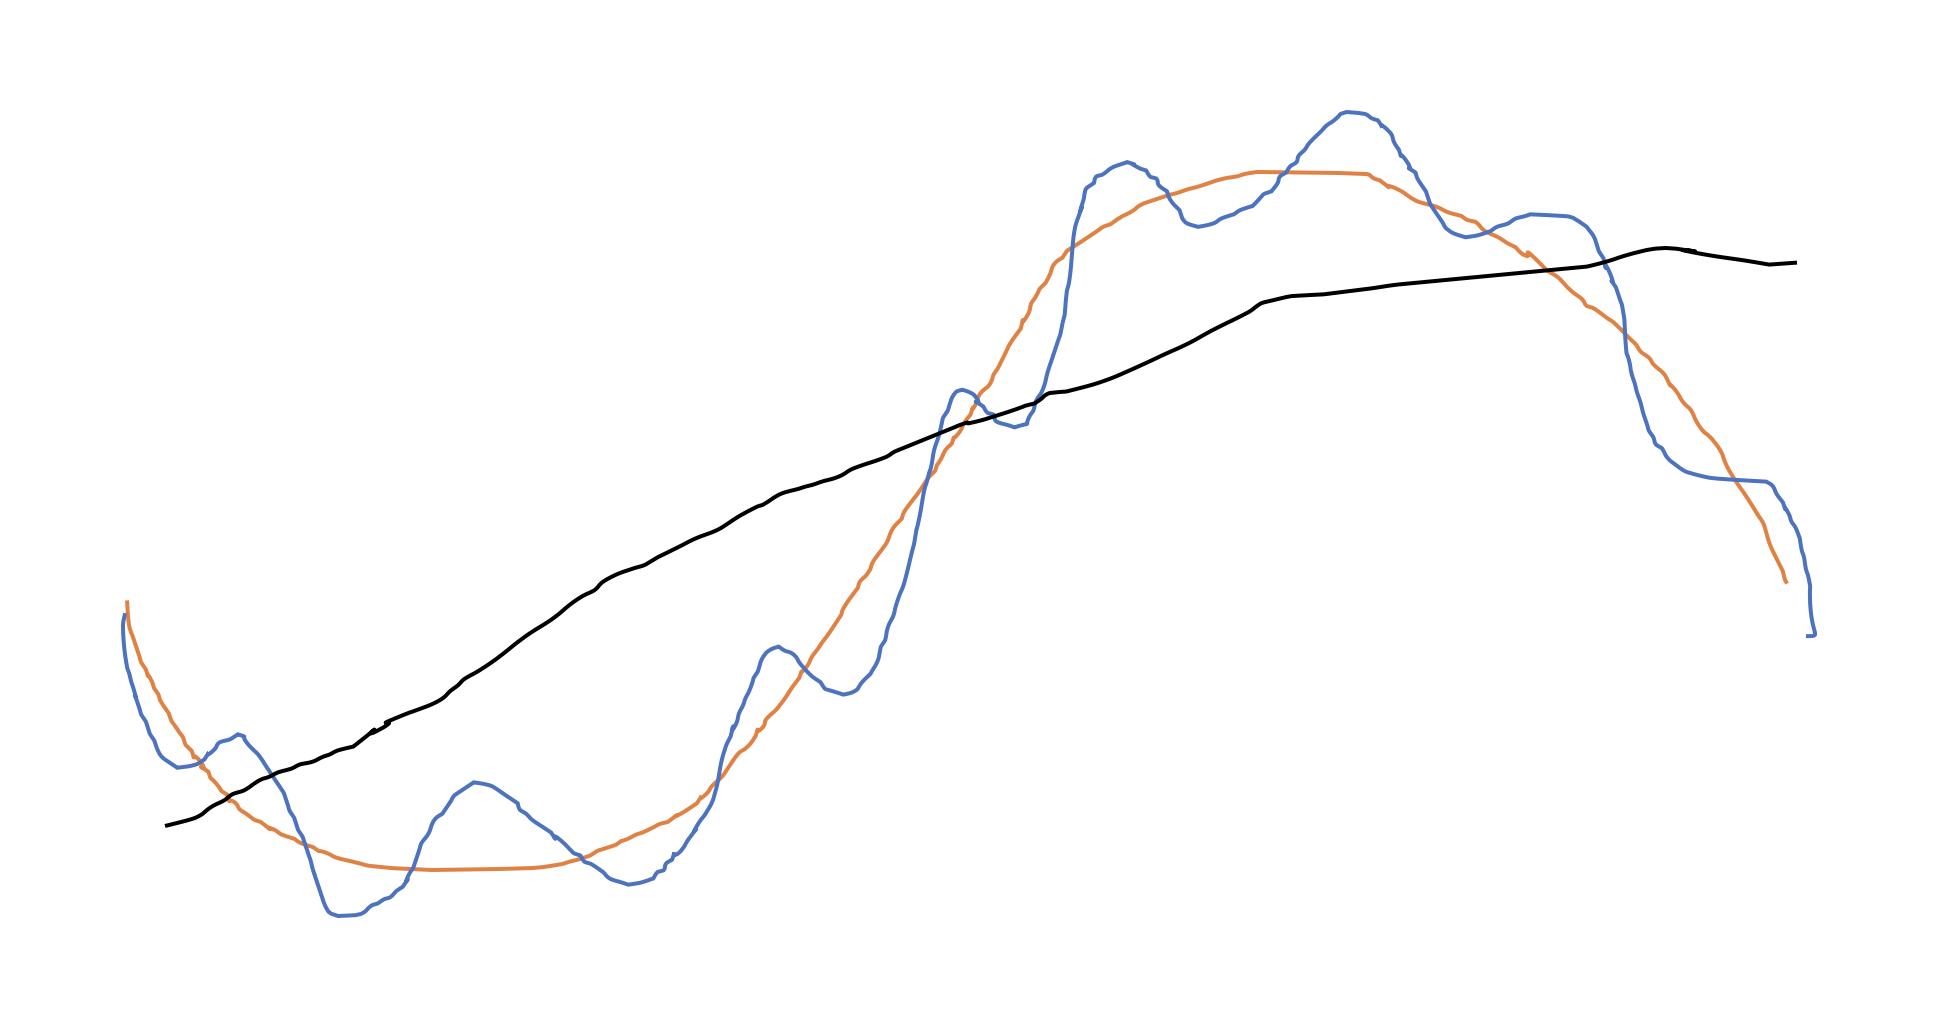
In this illustration, assume the orange line represents your investment horizon. The cycle on which you're operating is also part of a larger cycle (the black line). So, depending on where you are at within the larger cycle, that may impact how you approach your own time horizon.
Your investment horizon is also affected by the shorter-term upswings and downswings, represented by the blue line. An awareness of this shorter-term time frame should help you approach your trades more tactically as you understand the best times to add positions.
Now let's get back to the chart of Amazon.
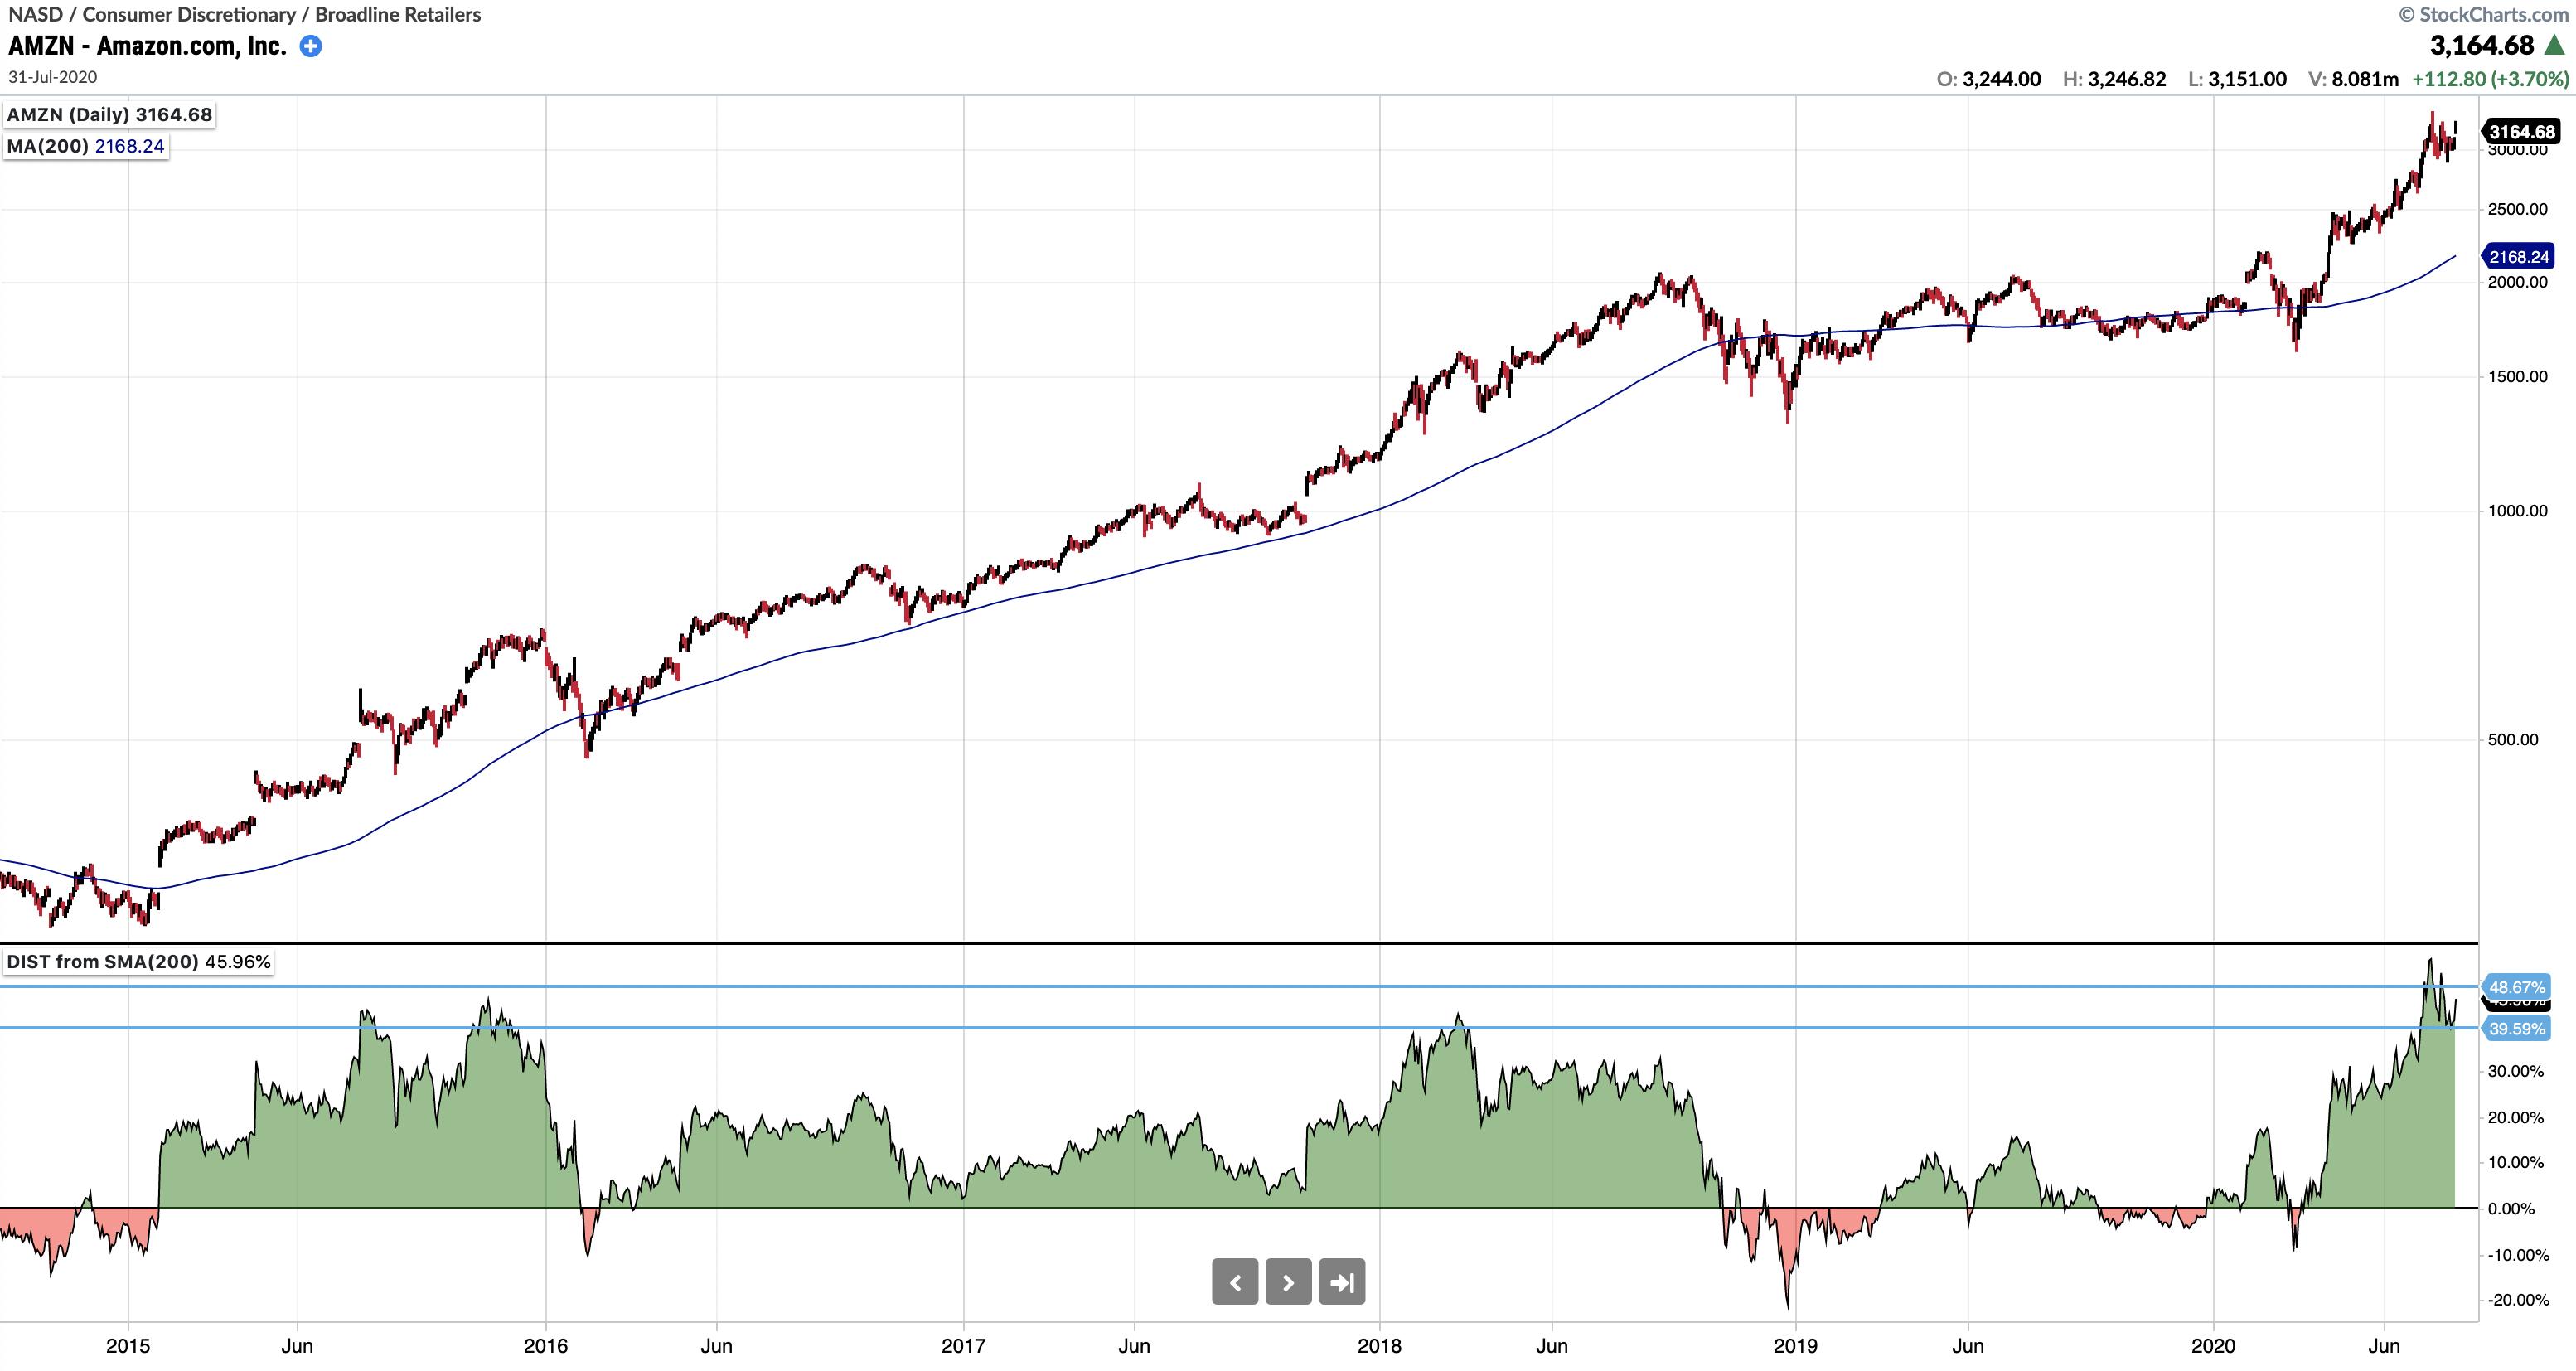
When you look at the last four years of data, you can see that AMZN was in a consistent uptrend through about the third quarter of 2018. That peak from September 2018 served as resistance again in mid-2019, and it happened to be right at the key psychological price level of 2000.
The break to new all-time highs in February 2020 was short-lived, as Amazon soon sold off along with most other stocks. The move back above 2000 in April signaled the "all clear" as the price continued to now over 3000.
This long-term trajectory from bottom left to upper right on the chart illustrates the long-term trend of Amazon. We can use the new StockChartsACP Advanced Indicator Pack to identify short-term tops within that uptrend, which gave valuable signals of potential pullbacks within the larger uptrend.
The bottom panel on this chart represents the distance of the price from its 200-day simple moving average, a common long-term price gauge favored by institutional investors.
You'll note that three times over the last four years, when the price reached at least 40% above its 200-day moving average, the price soon corrected back down. Although the long-term trend was still intact, each of these points identified an excessive upswing that needed to be "digested" first before the long-term uptrend could continue.
The last couple weeks have seen AMZN's price reach over 50% above its 200-day moving average. Based on the traditional application of this technical indicator, the base case would include a short-term pullback to digest recent gains before a resumption of the long-term uptrend.
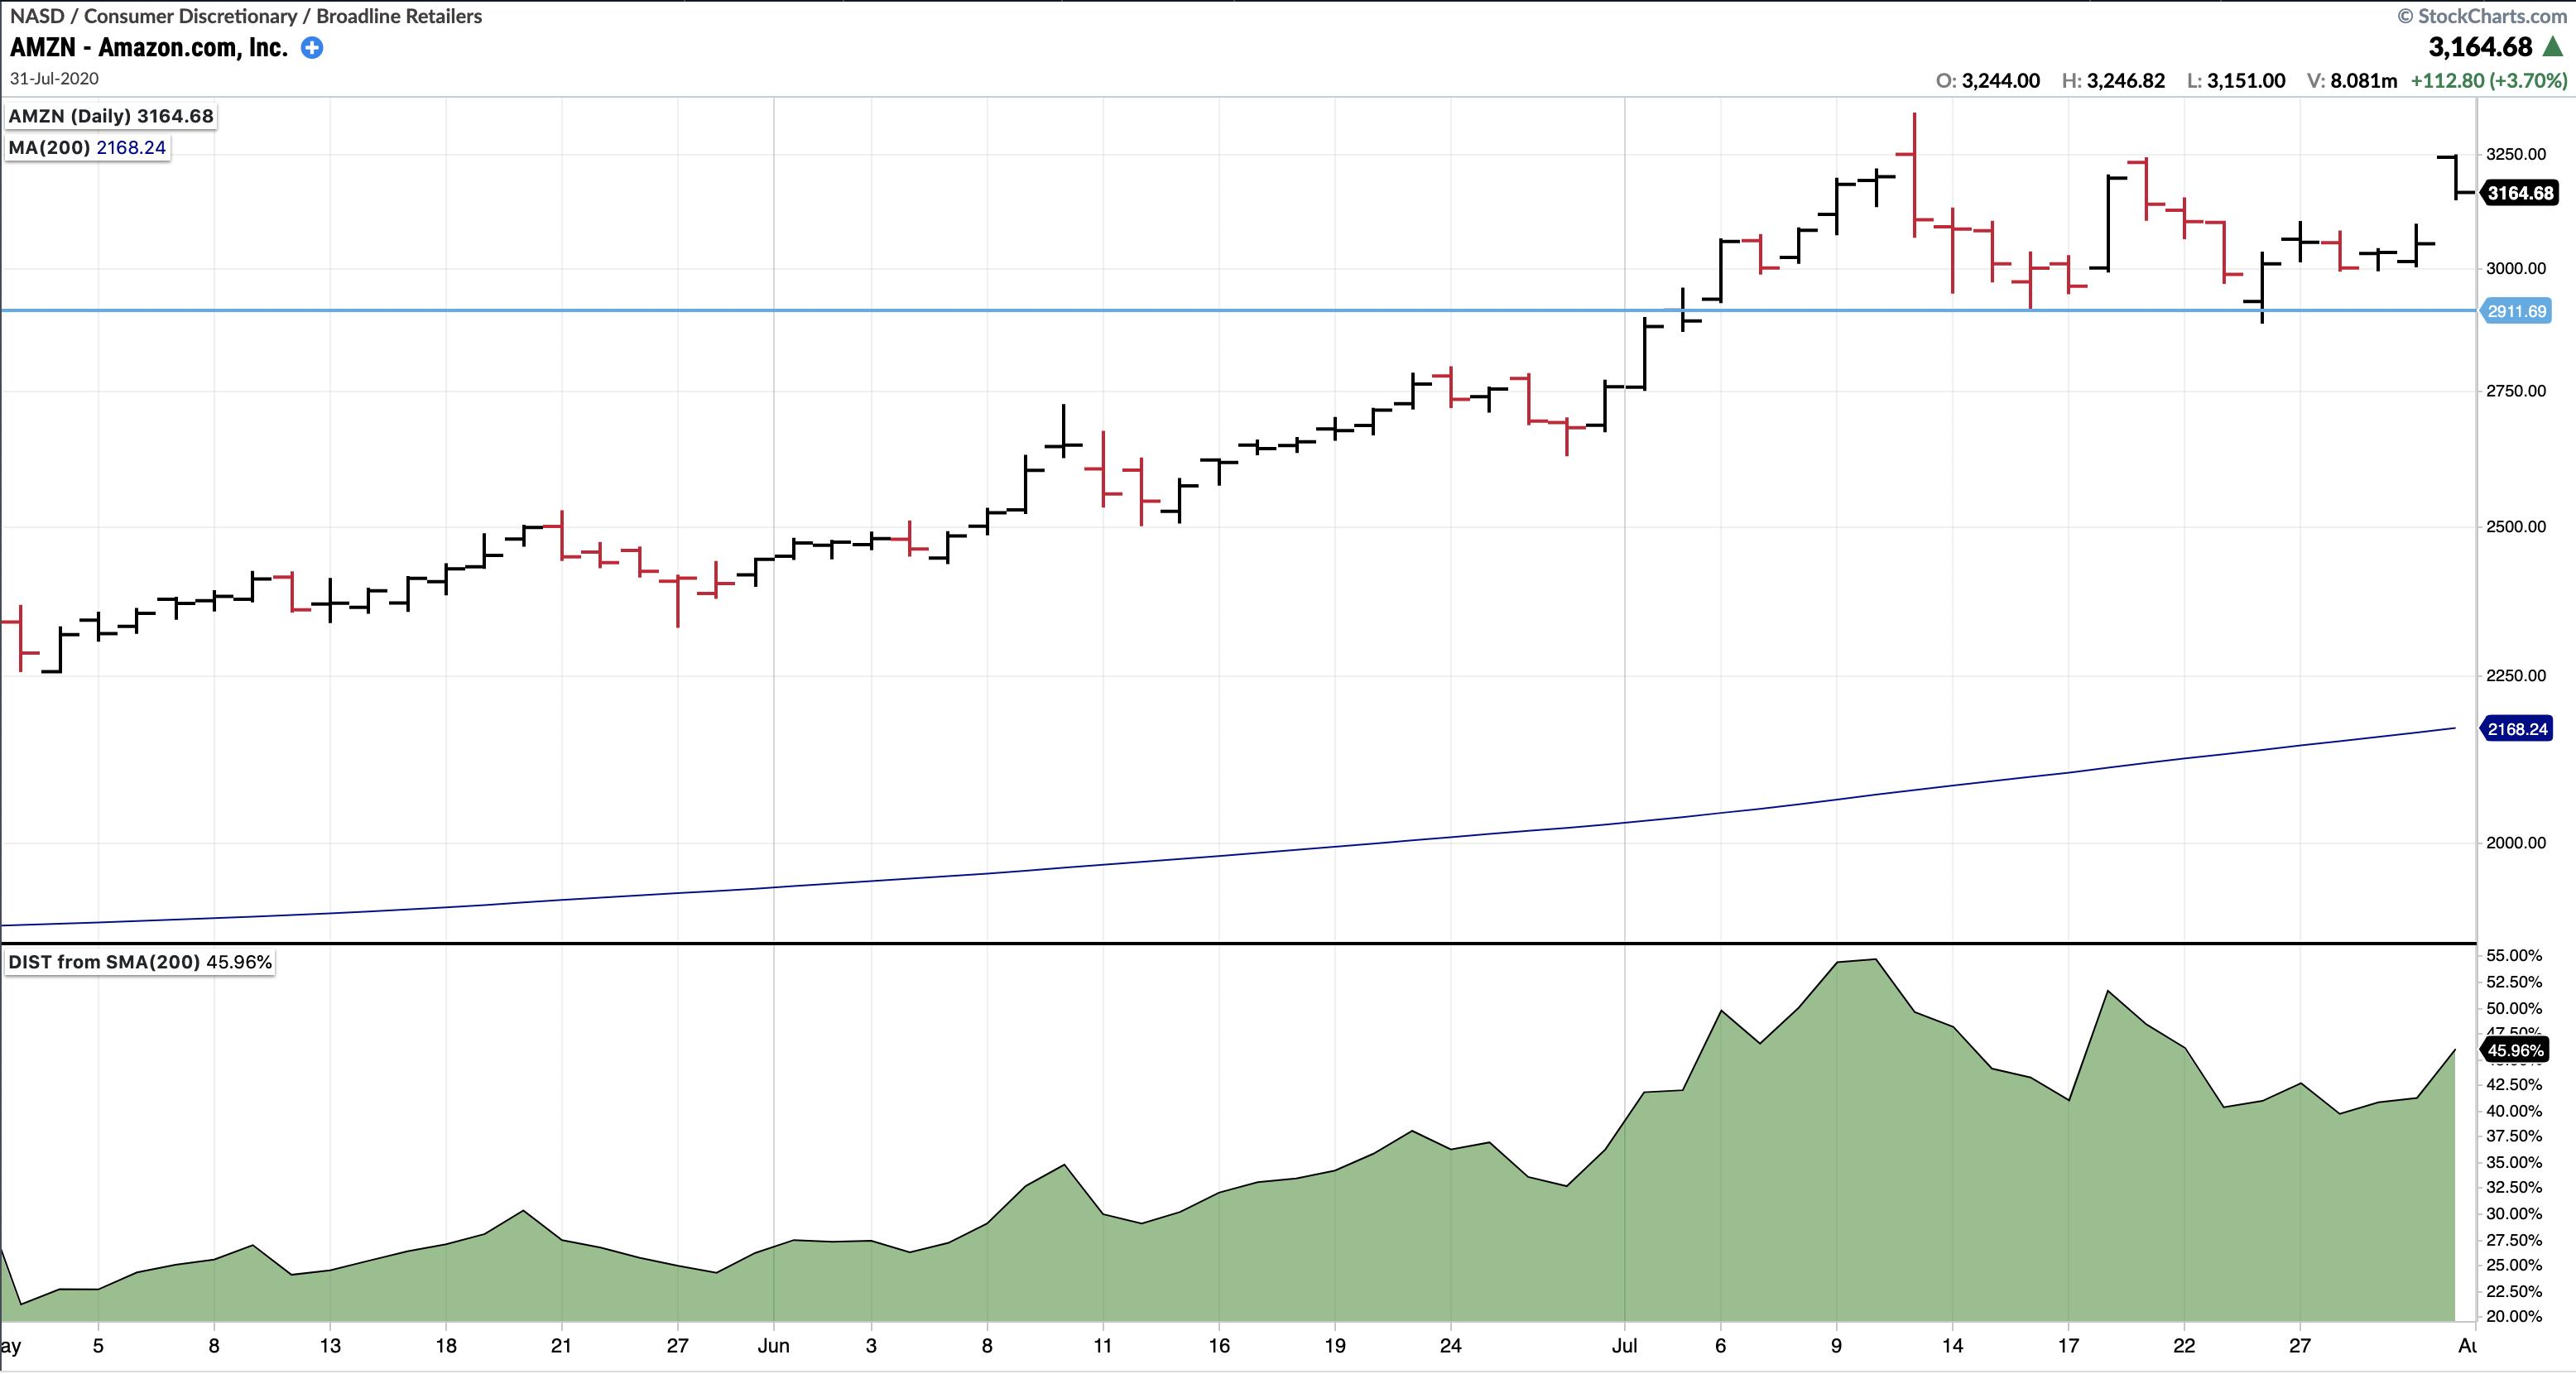
As with any leading indicator such as this, I would always look for confirmation of a pullback to confirm the short-term bearish thesis. In this case, a break to a new swing low (below 2911) would suggest further weakness until the excessive upside momentum has been alleviated.
RR#6,
Dave
David Keller, CMT
Chief Market Strategist
StockCharts.com
Disclaimer: This blog is for educational purposes only and should not be construed as financial advice. The ideas and strategies should never be used without first assessing your own personal and financial situation, or without consulting a financial professional.
The author does not have a position in mentioned securities at the time of publication. Any opinions expressed herein are solely those of the author and do not in any way represent the views or opinions of any other person or entity.


