A lot more attention is being paid to moving average lines this month because they help determine where potential support and resistance levels may lie. Two that have been mentioned quite a bit lately are the 50- and 200-day averages. Moves above and below the 50-day lines help determine the direction of short- to intermediate price moves. While the 200-day lines help determine the direction of major market moves. A third moving average watched by traders is the 100-day average. We'll incorporate that third moving average on today's price charts. The fact that all three major stock indexes fell below their 50-day averages raised the possibility of a drop to one or both of their longer-term averages.
Chart 1 shows the Dow Industrials drawing dangerously close to its red 200-day average and potential chart support along its late-July low (green circle). In addition, the Dow is sitting right on its 100-day average (green line) which may provide some additional support. That might be a logical spot for it to attempt to rebound. In order for that to happen, however, the Dow would have to rise back above its blue 50-day average to improve its short-term picture. In the event that those underlying support levels fail to hold, the next level of more substantial chart lies near its June lows in the vicinity of 25,000.
The daily bars in Chart 2 show the S&P 500 trying to stabilize at its 100-day average (green line) and potential chart chart along its late July low near 3200. Its red 200-day average lies at 3107. There again, the SPX would have to close above is blue 50-day line to strengthen its short-term trend. As with the Dow, the next level of substantial chart support lies along the June lows if the moving average lines don't hold.
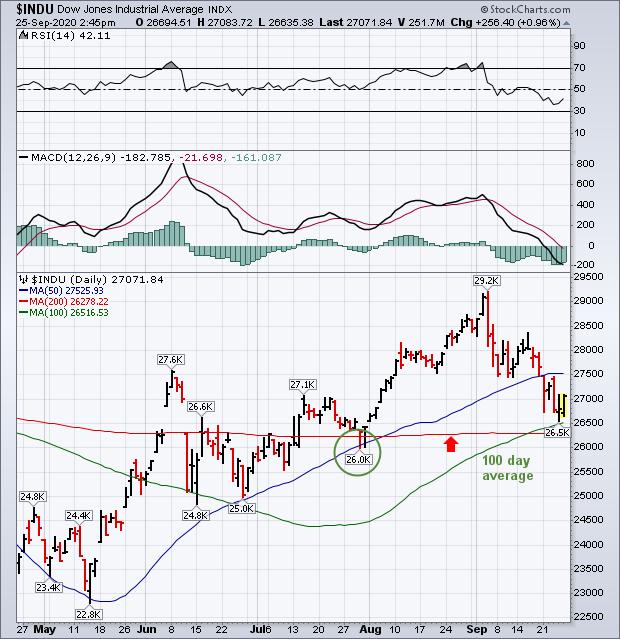 Chart 1
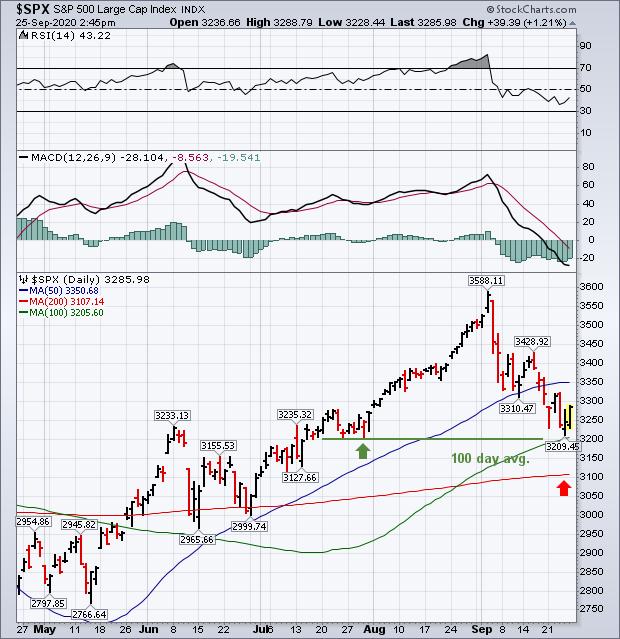 Chart 2
Today's last chart may be the most important of all because it's driven by the large technology stocks that have driven most of this year's stock rally. The daily bars in Chart 3 show the Invesco QQQ Trust (which measures the Nasdaq 100 Index) trading above its green 100-day average and attempting to stabilize. It's already lost more than 10% during September to lead the market lower and enter an official correction. The green horizontal lines plot Fibonacci retracement levels measured from its March low to its early September high. The top line shows a 38% retracement coinciding with its July reaction low near 250. That would represent a significant test of support if the QQQ correction deepens. Because of its stronger performance this year, the QQQ is the furthest away from its 200-day average. It would have to lose 50% of this year's gains to reach that long-term support line. On a shorter-term basis, the QQQ needs a close above its blue 50-day line to sustain any rally attempt.
Keep in mind that the stock market has entered a period of seasonal volatility which is compounded this year by pandemic concerns and uncertainties surrounding the November election. That raises the risk for more market volatility which could last up to and beyond the election. Those factors combined with a weaker technical condition suggest the potential for more stock weakness ahead; or a period of choppier trading. Which warrant a more cautious attitude on stocks over the next couple of months. The moving averages on today's charts offer clues on where some potential support levels may lie below the market if it continues to weaken.
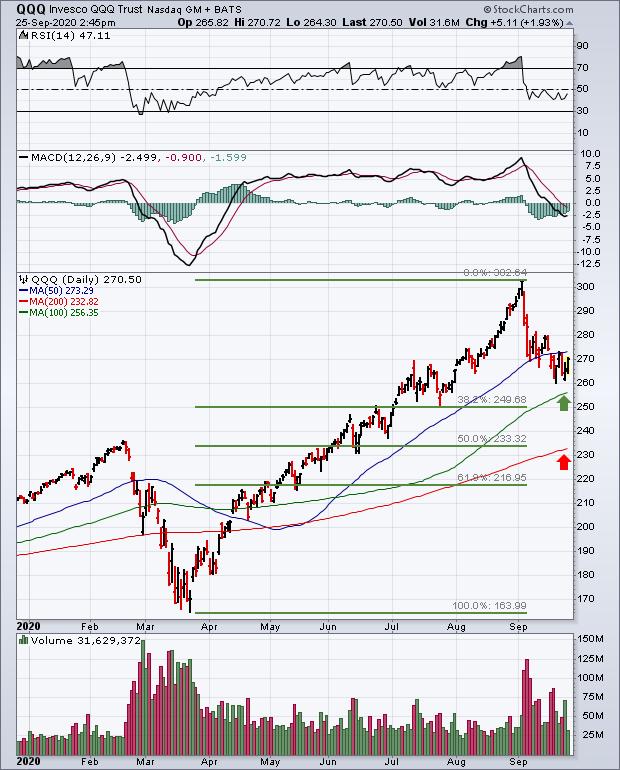 Chart 3
Editor's Note: This is an article that was originally published in John Murphy's Market Message on Friday, September 25th at 2:48pm ET. John Murphy also recently appeared in the "Introducing StockChartsACP: The Future of Technical Analysis" event; you can watch his segment below.


