Last week, after presenting a "diamond in the rough" in Wednesday's Diamonds Report, Carl texted me and said that it looked like a "pig's ear" chart pattern. I had never heard him use this term (yes, Dad, never!) and decided to investigate further. Below is the chart he was referring to:
This is the chart as I presented it on Wednesday:
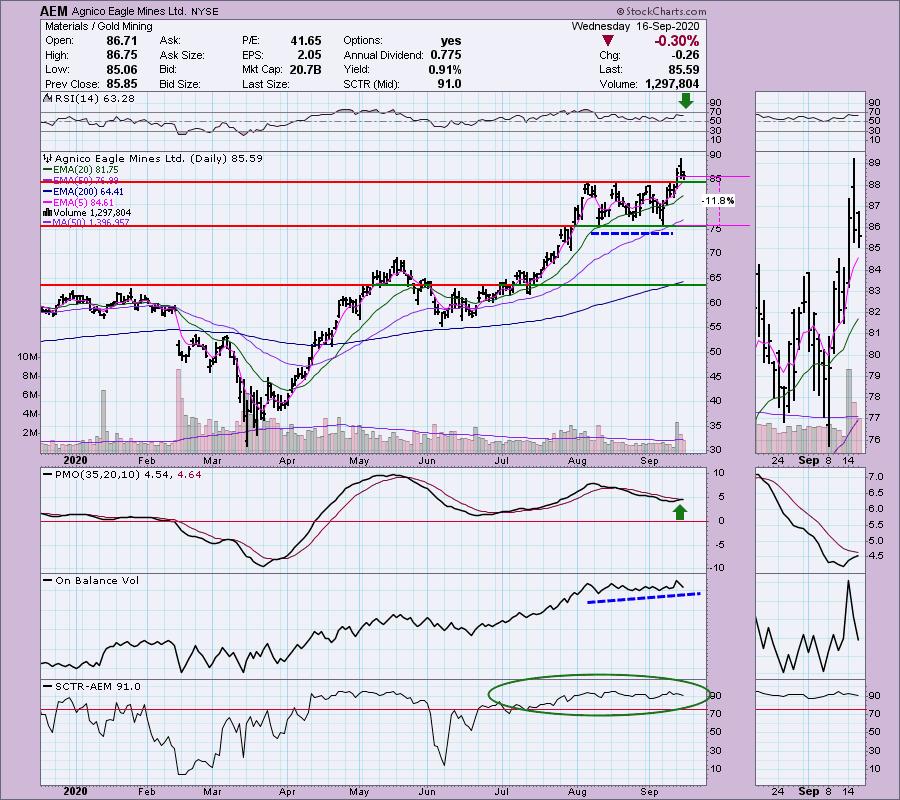
What I saw was a PMO that was nearing a BUY signal, a strong SCTR ranking, a positive RSI and an upside breakout from a consolidation zone. You can see why Carl named it a "pig's ear" just by the way it appears to be sticking out from the original rising trend, with that breakout putting the "point" on the ear. I was puzzled that he saw a bearish chart and not a bullish chart.
Well, today's AEM chart shows who was right... and it wasn't me. I then got very curious about this "pig's ear" pattern and looked for it in the Encyclopedia of Chart Patterns by Thomas Bulkowski. That is a book every chart pattern wonk should own. True to its name, it is an encyclopedia, overflowing with patterns you may not have even heard of. And the best part? He has back-tested them! You can learn more on thepatternsite.com. If you aren't a chart pattern wonk like me, Bulkowski's Visual Guide to Chart Patterns is also excellent. It covers the basic patterns and covers the psychology behind them.
Well, the "pig's ear" was not in the Encyclopedia of Chart Patterns, but "rectangle" patterns were, and.... drum roll... it is a bearish reversal pattern, not a continuation pattern. One may think it resembles a bull flag. I agree, which was why I considered that it was a continuation pattern. But let's get "textbook" - a bull flag has a downward sloping flag or a pennant (symmetrical triangle) on a flagpole. So this one actually resolved "pattern-wise" back to the downside, as expected. Right now, I'm bearish on AEM until it finds support at either the 50-EMA or the bottom of the rectangle. Based on Thomas Bulkowski's theory, it should actually break down out of that rectangle.
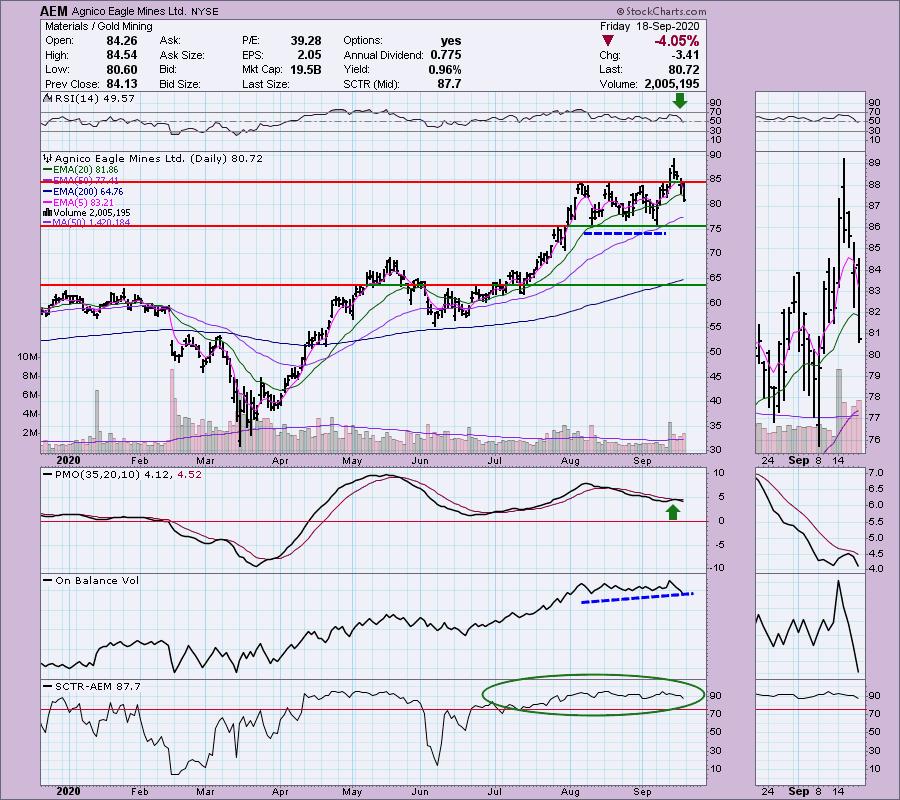
Conclusion: As they say, you learn something new everyday. The rectangle chart pattern is not a continuation pattern, it is a reversal pattern.
Do not miss our FREE DecisionPoint LIVE Trading Room on Mondays at noon ET. Details on registering for the Trading Room are below! Read on for the ChartWatchers "Diamond of the Week".

Register for the Free Trading Room at this link or click above. Our next session is on 9/21/2020!
Here is a link to the recording from 9/14/2020 (Access Passcode: 3^aXxCJ2)
DecisionPoint Diamonds are becoming even more indispensable! Not only do you get 60 "Diamonds in the Rough" stocks/ETFs per month, with complete analysis including stops/targets... but there will now be a Friday Diamonds Recap that will look at the performance of each week's Diamonds and their prospects moving forward. Over the weekend, we clean the slate and start over again.
Included for my Diamonds subscribers only is a one-hour trading room, "The DecisionPoint Diamond Mine" on Fridays! It will provide an opportunity for us to talk live, review current and past Diamonds for possible entries/exits/stops/targets and take your questions and symbol requests in this intimate trading room.
DecisionPoint Alert subscribers continue to enjoy clear, concise analysis of the overall market, including Dollar, Gold, Gold Miners, Oil and Bonds from both Erin and Carl Swenlin. You will be prepared each market day knowing the implications of market behaviors for that day, week and month!
All subscribers have access to our exclusive ChartLists, which are annotated and curated by Carl Swenlin. Know what he thinks is important for all of the sectors, indexes, indicators and more!
Today's ChartWatchers "Diamond of the Week":
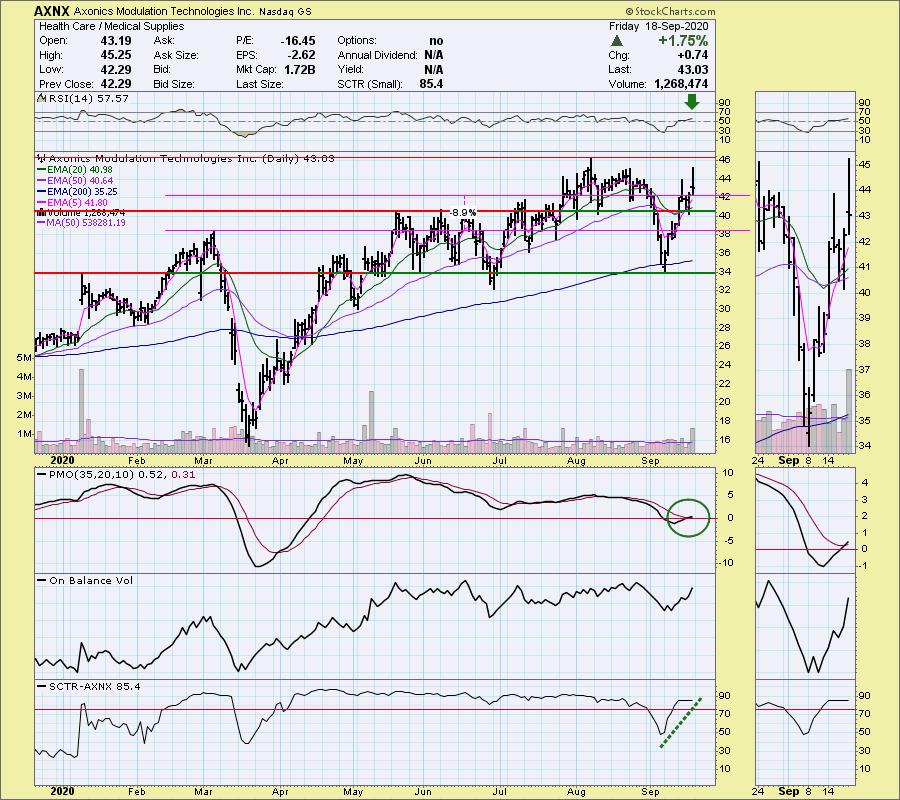
This "Diamond in the Rough" selection is from the September 17, 2020 DecisionPoint Diamonds Report. I have included the chart from Thursday with my original comments, after which I follow up with the current chart.
Axonics Modulation Technologies Inc (AXNX)
EARNINGS: 11/12/2020 (AMC)
Axonics Modulation Technologies, Inc. operates as a medical technology company, engaging in the design, development and commercialization of sacral neuromodulation solutions. The firm focuses on the treatment of patients with overactive bladder (OAB), fecal incontinence (FI) and urinary retention (UR). It offers rechargeable SNM systems, which deliver mild electrical pulses to the targeted sacral nerve in order to restore normal communication to and from the brain to reduce the symptoms of OAB, FI and UR. The company was founded by Guang Qiang Jiang, Danny L. Dearen, Timothy Deer, and Michael V. Williamson in March 2012 and is headquartered in Irvine, CA.
Thursday's Chart (yellow) and Comments:
"Down -0.69% in after hours trading, AXNX is my Diamond in the Rough today. I like the indicators here. The RSI is just getting positive and the PMO is about to give us a crossover BUY signal. In the thumbnail, you can see that the 20/50-EMAs are the current support point. I set the stop level to the March top. The SCTR had retreated from the "hot zone" above 75, but has recovered."
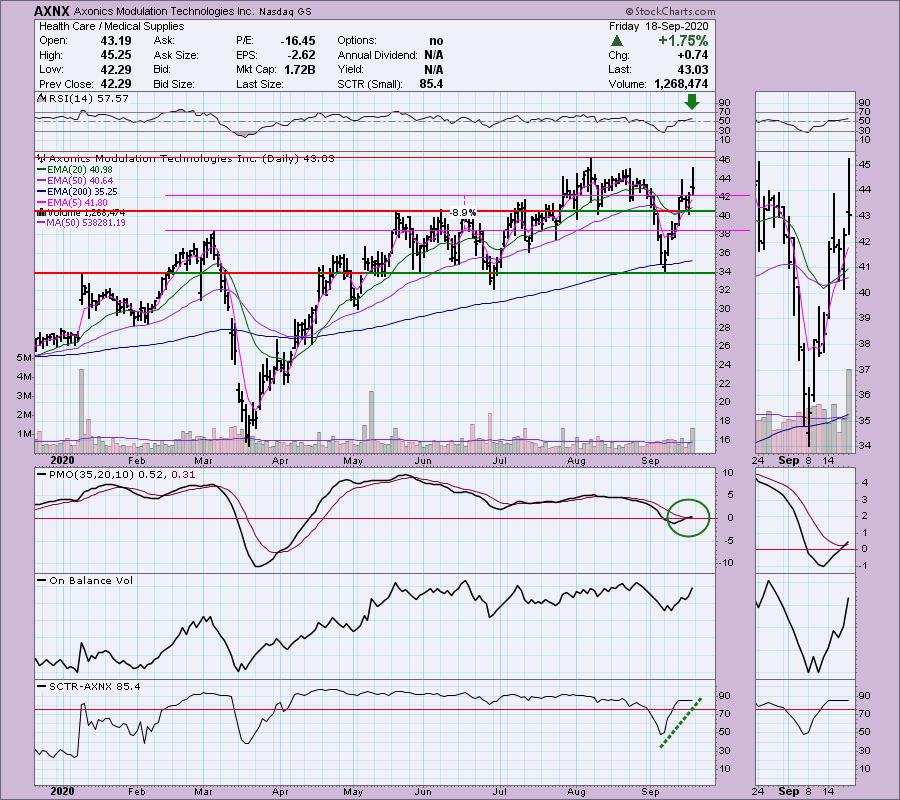
Friday's Chart (plum) & Comments:
I still like the chart. The RSI is positive and the "V" bottom is resolving nicely to the upside. The PMO has just triggered a BUY signal. Granted, overhead resistance is arriving soon at $46, but, based on the positive momentum and big volume, I don't think we will have a problem with it.
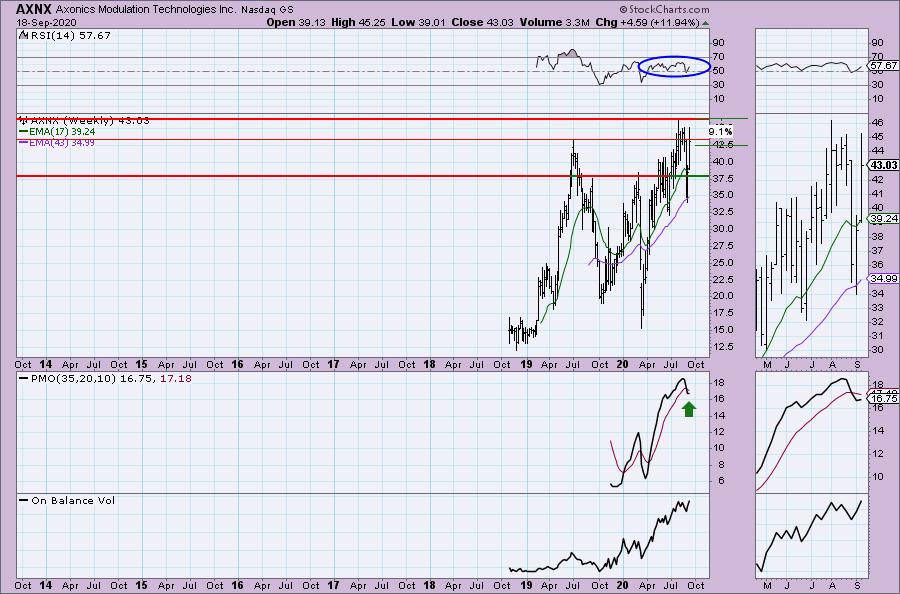
Weekly Chart & Comments as of today:
I like the RSI on the weekly, but I'm not thrilled with the PMO. The good news is it did turn back up. The 9.1% shows what the potential gain would be if it reached all-time highs from when I presented it on Thursday.
TRY US OUT! Don't forget, you can give our reports a try with a 1-week free trial by subscribing to the "Bundle" package and using coupon code: dptrialcw.
Happy Charting! - Erin
Technical Analysis is a windsock, not a crystal ball.
Helpful DecisionPoint Links:
DecisionPoint Alert Chart List (subscribers only)
DecisionPoint Golden Cross/Silver Cross Index Chart List (subscribers only)
DecisionPoint Sector Chart List (subscribers only)
Price Momentum Oscillator (PMO)
Swenlin Trading Oscillators (STO-B and STO-V)


