Healthcare stocks are leading the market higher for a change. The daily bars in Chart 1 show the Health Care SPDR (XLV) nearing a test of its recent highs after finding support near its 50-day moving average. The solid line overlaid on the chart plots a relative strength ratio for the sector and shows it underperforming the market since the spring. The ratio, however, has stabilized since September which suggests that some money is starting to flow back into the sector. All parts of the XLV are rising today. The strongest performance is coming from healthcare providers.
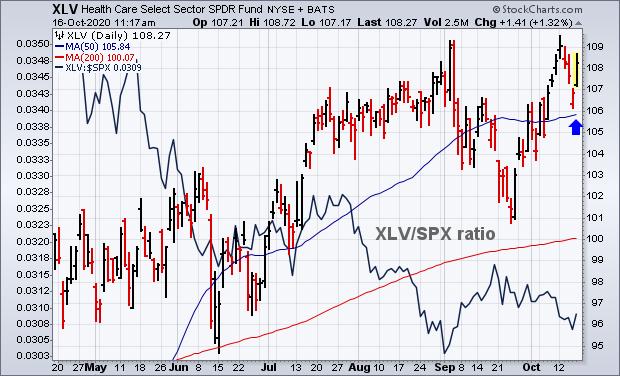 Chart 1
The daily bars in Chart 2 show the Dow Jones Health Care Providers Index challenging its February peak. A close above that level would constitute a bullish breakout for the group. Its relative strength line in the upper chart is turning up as well. Several individual stocks in the group have already set a new record, or are close to doing so.
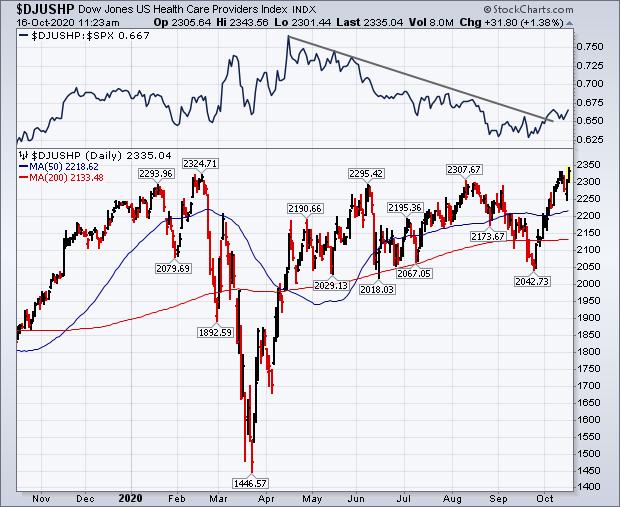 Chart 2
The next three healthcare leaders have already reached new records. Chart 3 shows Molina Healthcare (MOH) breaking through its May/August highs to set a new record. Chart 4 shows Humana (HUM) setting a new record by exceeding its September high. Chart 5 shows Unitedhealth Group (UNH) in record territory as well. That's a good sign for the group and the healthcare sector. Anthem hasn't set a record yet, but may be close to doing so.
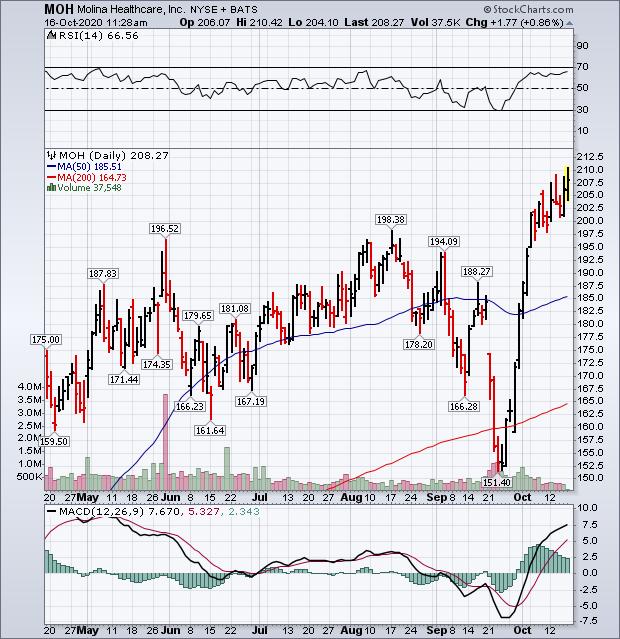 Chart 3
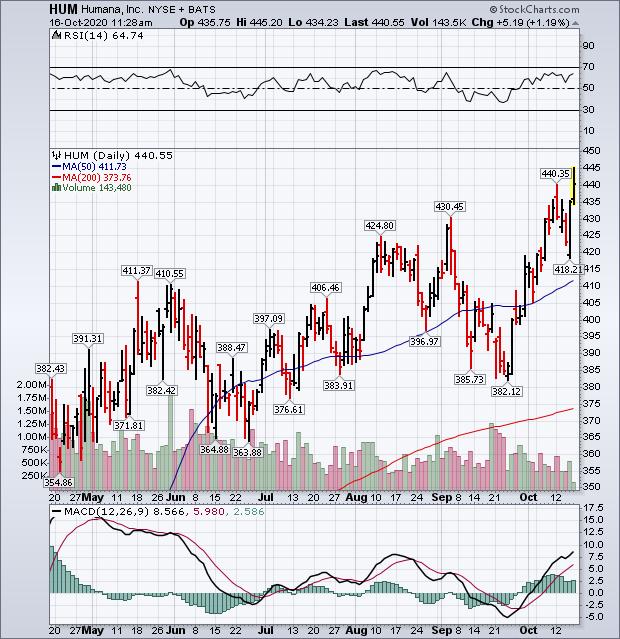 Chart 4
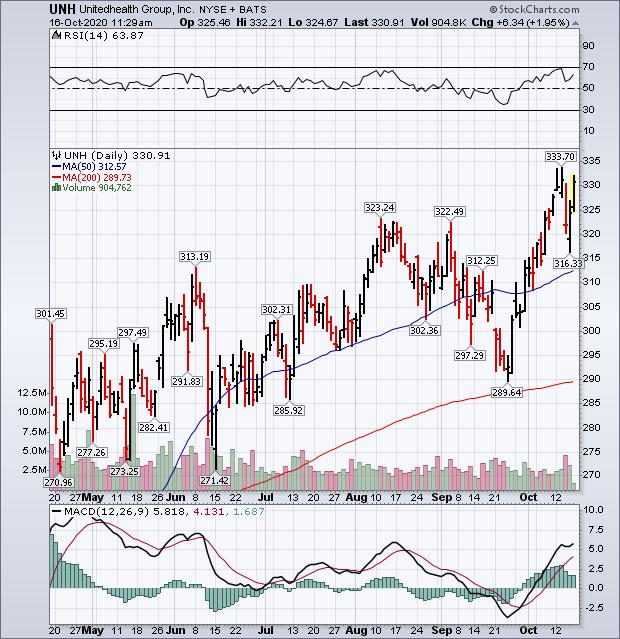 Chart 5
The weekly bars in Chart 6 show Anthem (ANTM) trading sideways since the start of 2019. But it's challenging its summer high near 300, and may be about to challenge its previous highs. Its 14-week RSI line in the upper box is at the highest level since the start of the year; and its weekly MACD lines (middle box) have turned positive. A decisive close above 300 would increase its odds for a new record.
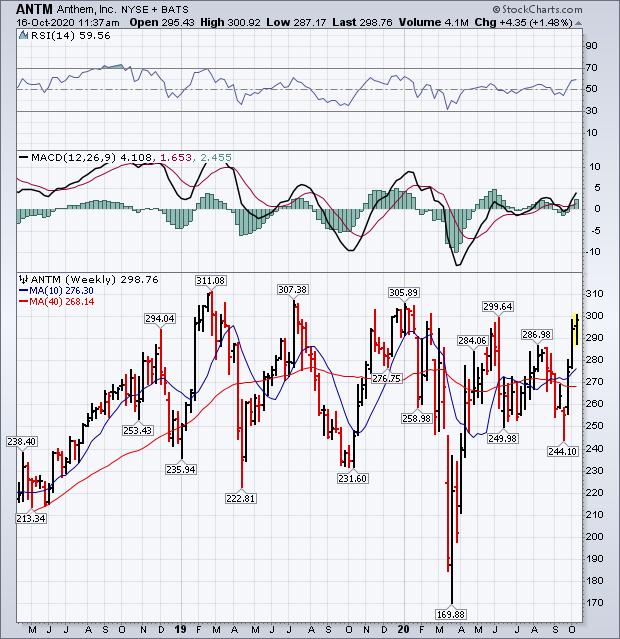 Chart 6
Editor's Note: This is an article that was originally published in John Murphy's Market Message on Friday, October 16th at 11:56am ET.


