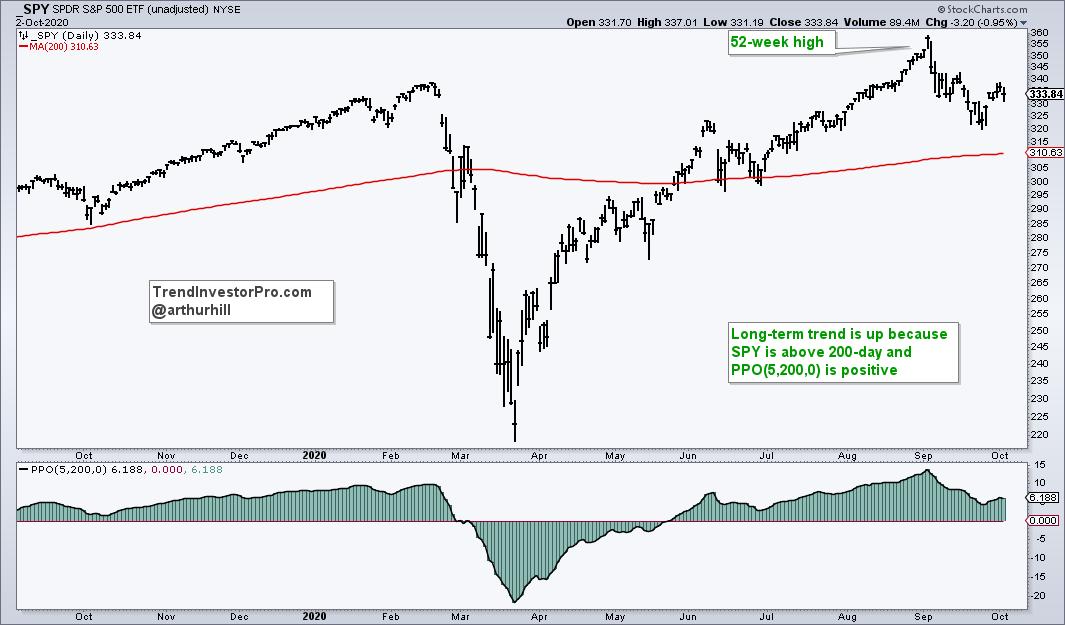
The S&P 500 SPDR (SPY) gapped up on Monday and broke out of a classic correction pattern. The breakout is bullish, but the coast is not entirely clear. Here's what to watch going forward.
First, the long-term trend is up as SPY hit a new high in early September and remains above the 200-day SMA, which is starting to flatten out. After hitting a new high, SPY retraced 50-61.8% of the June-Sept advance with a falling wedge that broke the 50-day SMA. Both the retracement amount and pattern are typical for corrections within a bigger uptrend.
SPY ended this small correction on Monday with a gap and wedge breakout. We have yet to see follow through because SPY fell back on Friday. Nevertheless, the gap and breakout are holding, which means the cup is half full. Chartists should watch this gap going forward because a close below 328 would fill the gap and negate the breakout.
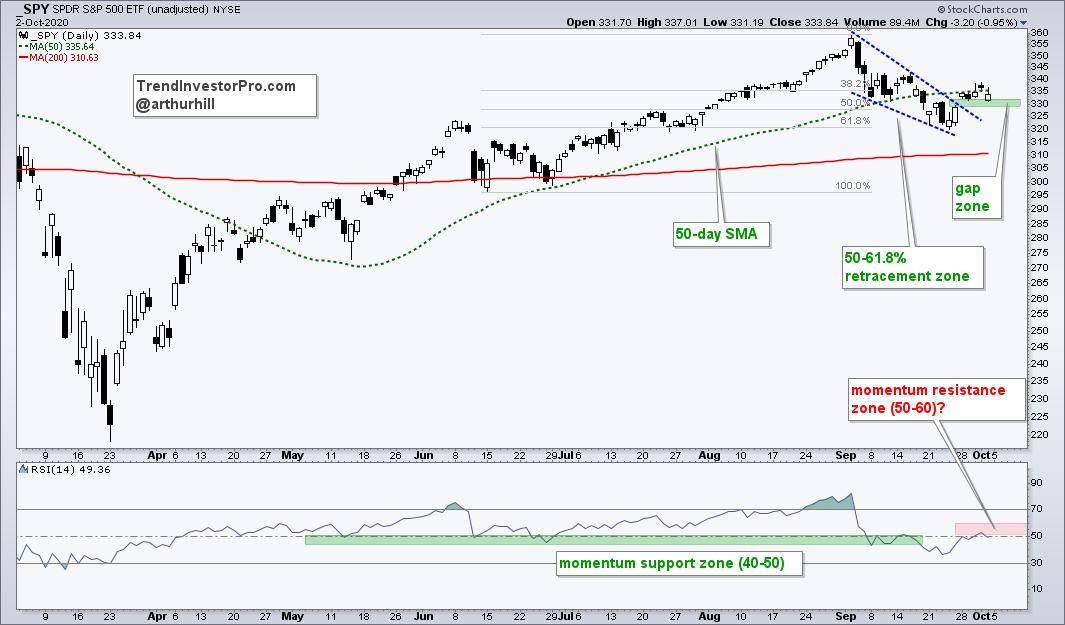
The indicator window shows RSI with a potentially bearish configuration. Notice that the 40-50 zone held in June as SPY corrected, but SPY broke below this zone in the second half of September (green shading). RSI typically ranges between 40 and 80 during an uptrend and this range was broken. In a downtrend, RSI ranges from 60 to 20 with the 50-60 zone representing momentum resistance of sorts. The 50-day SMA may be providing resistance as well.
Short-term, SPY is between a rock and a hard place. There is a little resistance from the 50-day SMA and 50-60 zone for RSI, while there is support from the gap and breakout zone. At this point, I give the bulls the benefit of the doubt because the bigger trend is up and the breakout is holding. A close below 328 calls for a re-evaluation.
There were a lot of falling wedge and flag breakouts in the core ETF chartlist at TrendInvestorPro.com. These patterns were shown in last Saturday's chartbook and the breakouts were updated in Thursday's report. Subscribe today for immediate access to the annotated ETF ChartBook, Market Timing Models and Weekend video.
------------------------------
Choose a Strategy, Develop a Plan and Follow a Process
Arthur Hill, CMT
Chief Technical Strategist, TrendInvestorPro.com
Author, Define the Trend and Trade the Trend
Want to stay up to date with Arthur's latest market insights?
– Follow @ArthurHill on Twitter


