 This past Monday, I asked three experts on the Presidential Cycle - Bruce Fraser, Jeff Hirsch, and Tom McClellan - to share their take on market trends around the election season. They delivered in a big way, and the result was a masterclass in how to learn from market history.
In the end, I learned that the four-year Presidential Cycle is just one of many cycles, from the ten-year cycle to the traditional 12-month seasonal cycle. I learned that a key data point is whether an incumbent party wins a second term or if the White House changes hands. I learned year-end tends to be strong regardless of who wins in November.
Here are my three main takeaways from this week's panel, The Presidential Cycle: A Technical Perspective.
First, election years overall tend to be pretty bullish.
Tom McClellan shared this chart, which shows the average price pattern for the US equity markets over the four-year election cycle.
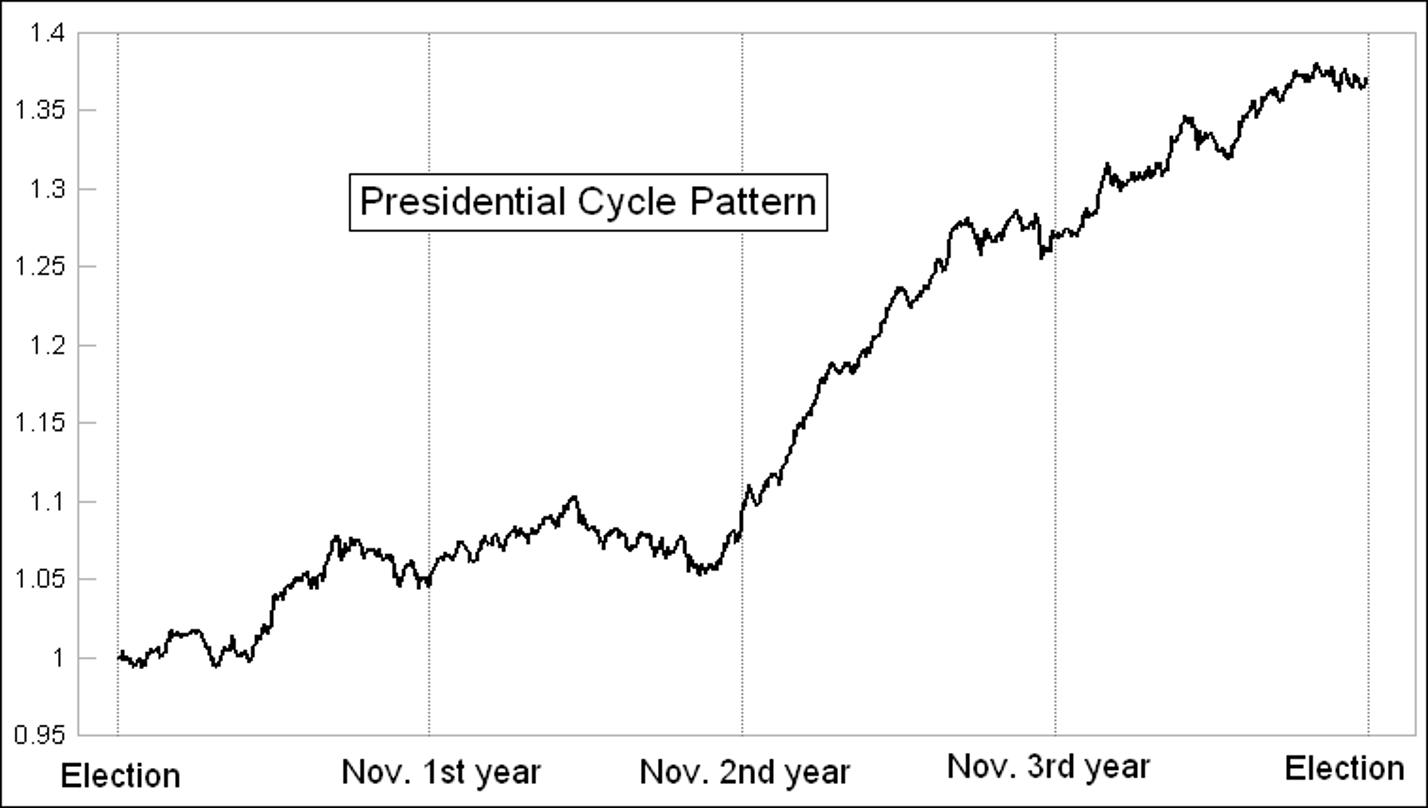
The first two years after the Presidential elections tend to be choppy, while years three and four tend to be more constructive, with the third year the strongest of them all.
The election year strength makes sense anecdotally, as the expectation is the current President would do everything they can to buoy the markets going into the elections. The year after an election is when a new President is most likely to pass new legislation unfavorable to the markets.
Second, November and December tend to be strong no matter what.
Jeff Hirsch's chart of the election year pattern showed that whether or not the incumbent party wins, the period from election day to year-end tends to be strong.
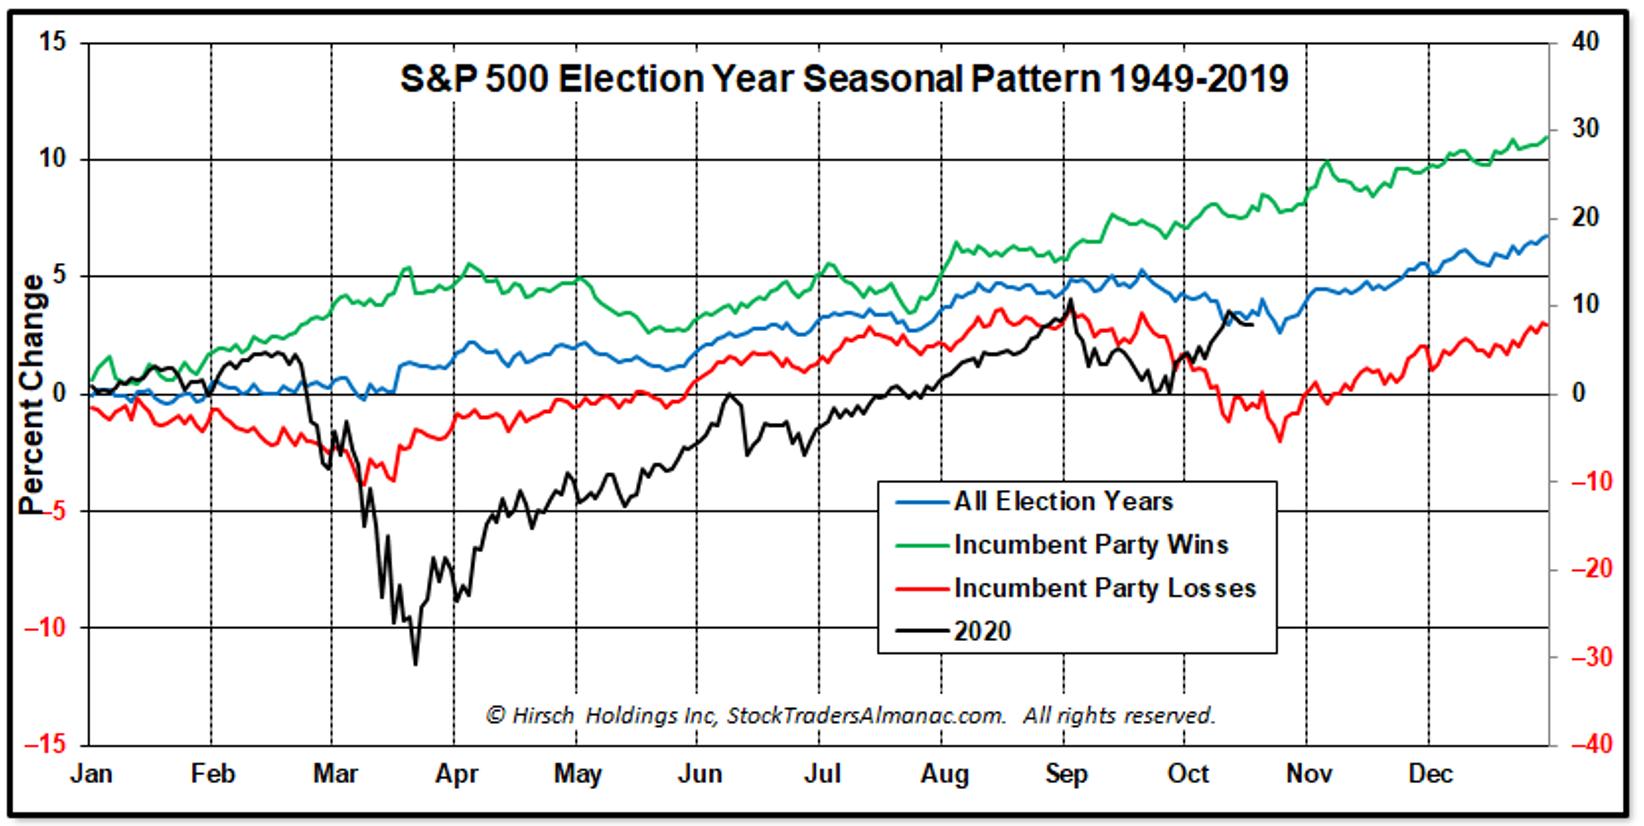
This means that the normal seasonal tendencies of strength starting in November are more at play here than some sort of reaction to the elections. A new President wouldn't put anything in motion until the new year, and this leaves the markets to trend higher overall.
Finally, there are many cycles at play here, from the seasonal cycle all the way to the 10+ year cycles.
Bruce Fraser walked through the decennial cycle and what tends to happen in years that end in zero. How does that relate to the four-year cycle?
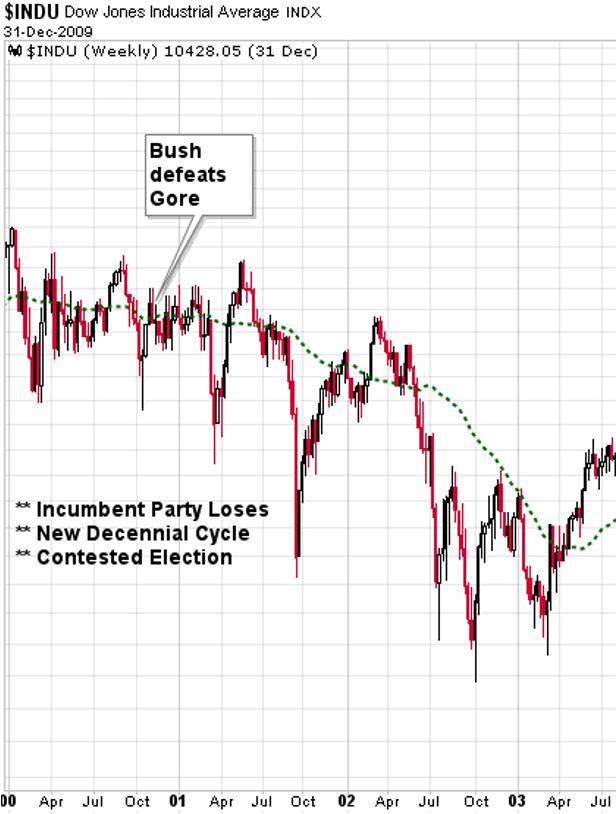
As we walked through the elections in 2000, 1980 and 1960, I was struck at how few observations we have of some of these overlapped cycles. Does that mean the information is less relevant? Not necessarily. Some of my favorite conversations with successful investors have been about how the current market relates to historical precedents. How does this particular top relate to other tops? How does this correction compare with other corrections in history?
While this allows for a more anecdotal review of the data, I think these discussions are helpful in examining how conditions are similar or different from previous events. This election may be uncharted territory (pun intended) for many reasons. But we can always see how the markets have fared around other elections, and that, in my opinion, is time well spent.
Our three panelists shared additional charts on how the year after a Presidential election tends to go, particularly if the incumbent party wins or loses. Also, I asked each for their investment ideas given all of the data we reviewed.
You can see all the additional charts as well as their best ideas on the replay video.
The Presidential Cycle: A Technical Perspective
RR#6,
Dave
David Keller, CMT
Chief Market Strategist
StockCharts.com
Disclaimer: This blog is for educational purposes only and should not be construed as financial advice. The ideas and strategies should never be used without first assessing your own personal and financial situation, or without consulting a financial professional.
The author does not have a position in mentioned securities at the time of publication. Any opinions expressed herein are solely those of the author, and do not in any way represent the views or opinions of any other person or entity.


