They say Copper is reputed to have a Ph.D. in economics because of its ability to predict turning points in the global economy. That arises because of copper's widespread applications in most sectors of the economy, from homes and factories to electronics and power generation. The implication from rising copper prices is, therefore, positive for the global economy. This week, the price broke out from a recent trading range, as did a couple of copper-related ETFs. The breakouts in and of themselves are not that big of a deal. When considered under the context of longer trends, though, they take on greater significance, since they add support to the view that the price of the red metal is in a primary bull market. That fits in very nicely with the current Stage III phase of Pring Turner's Six Stage business cycle analysis cycle, which you can about here.
Chart 1 sets the scene with this week's breakout above the July/October resistance trendline. This move is also being supported by the short-term KST in the lower window, which suggests that it has further to run.
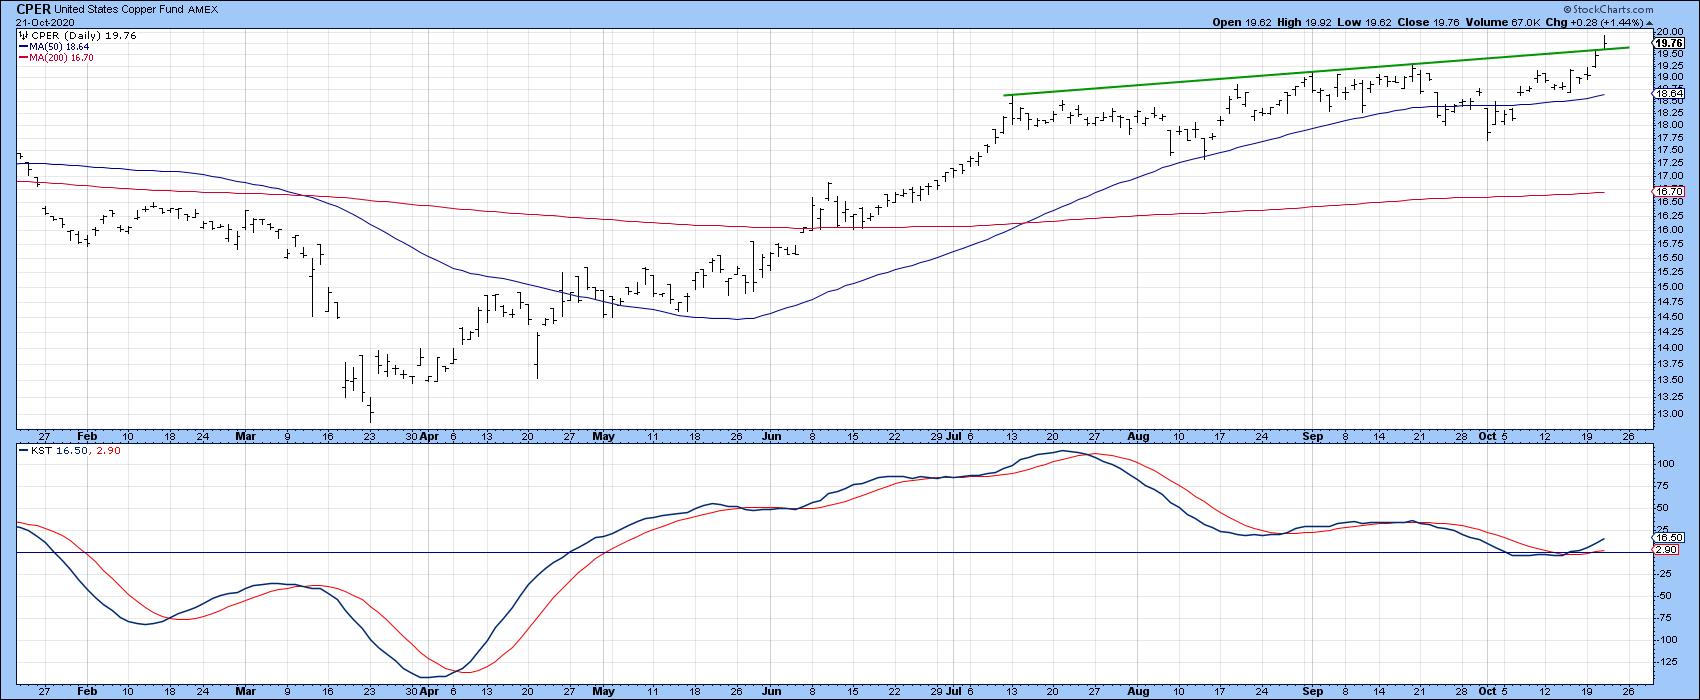 Chart 1
Chart 2 shows where this move fits into the big picture, as it reinforces the previous breakout above the 2011-2020 down trendline for both the price and its 9-month ROC. Note that the price is also comfortably above its 12- and 24-month MAs. The 12-month ROC is right at a major long-term resistance trendline. If this week's breakout on the daily chart is valid, it will also result in a 12-month ROC trendline violation, thereby transitioning Chart 2 into a fully bullish mode.
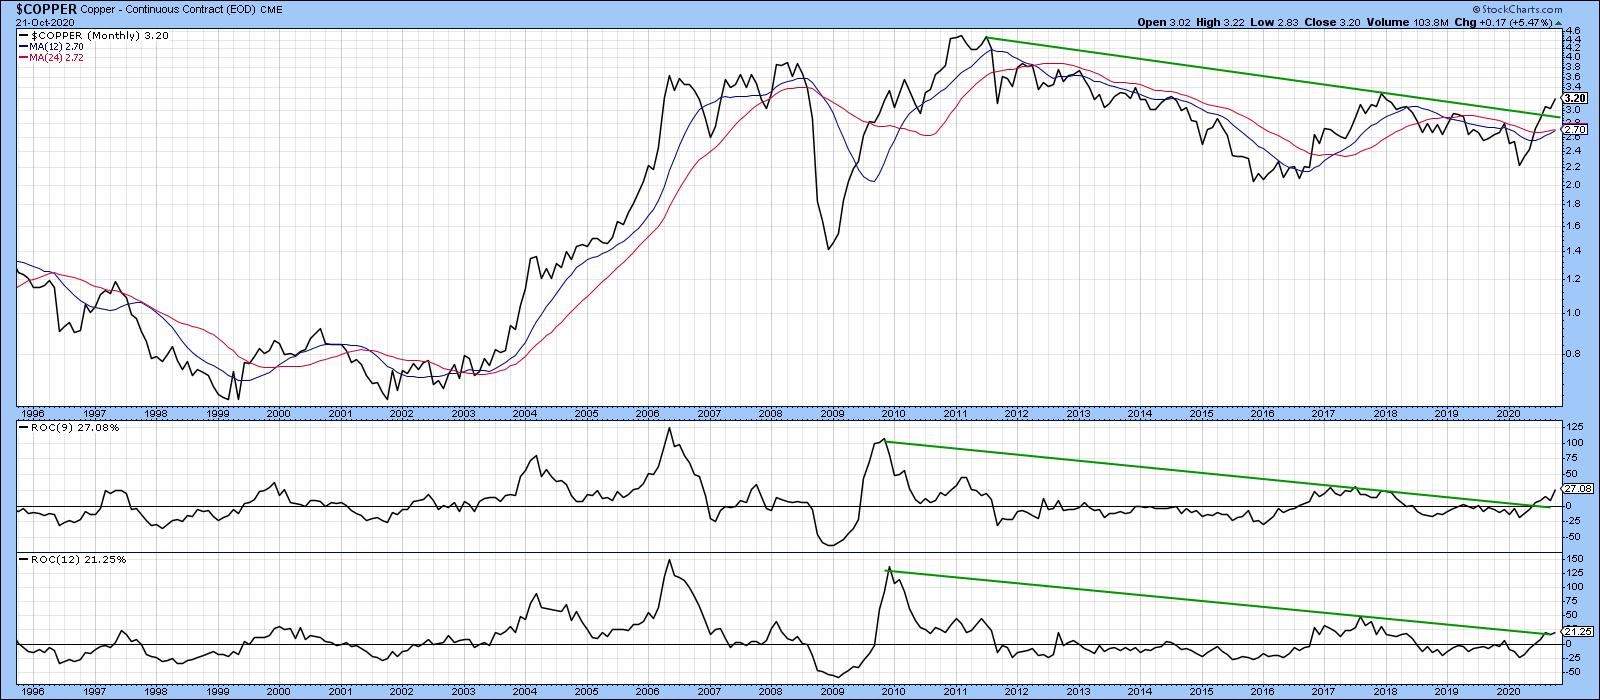 Chart 2
Evidence supporting the idea of a valid break is being given by Charts 3 and 4. Chart 3 features the Global X Copper Miners ETF (COPX), where we can see the price clearing its 50-day MA and small green resistance trendline at a time when the KST has just gone bullish. It's true that the 9-day RSI is overbought, but, as you can see from the June-August period, the bull market protected the price from suffering that much from an overstretched reading. In effect, this failure to trigger a more serious decline is a characteristic of a bull market.
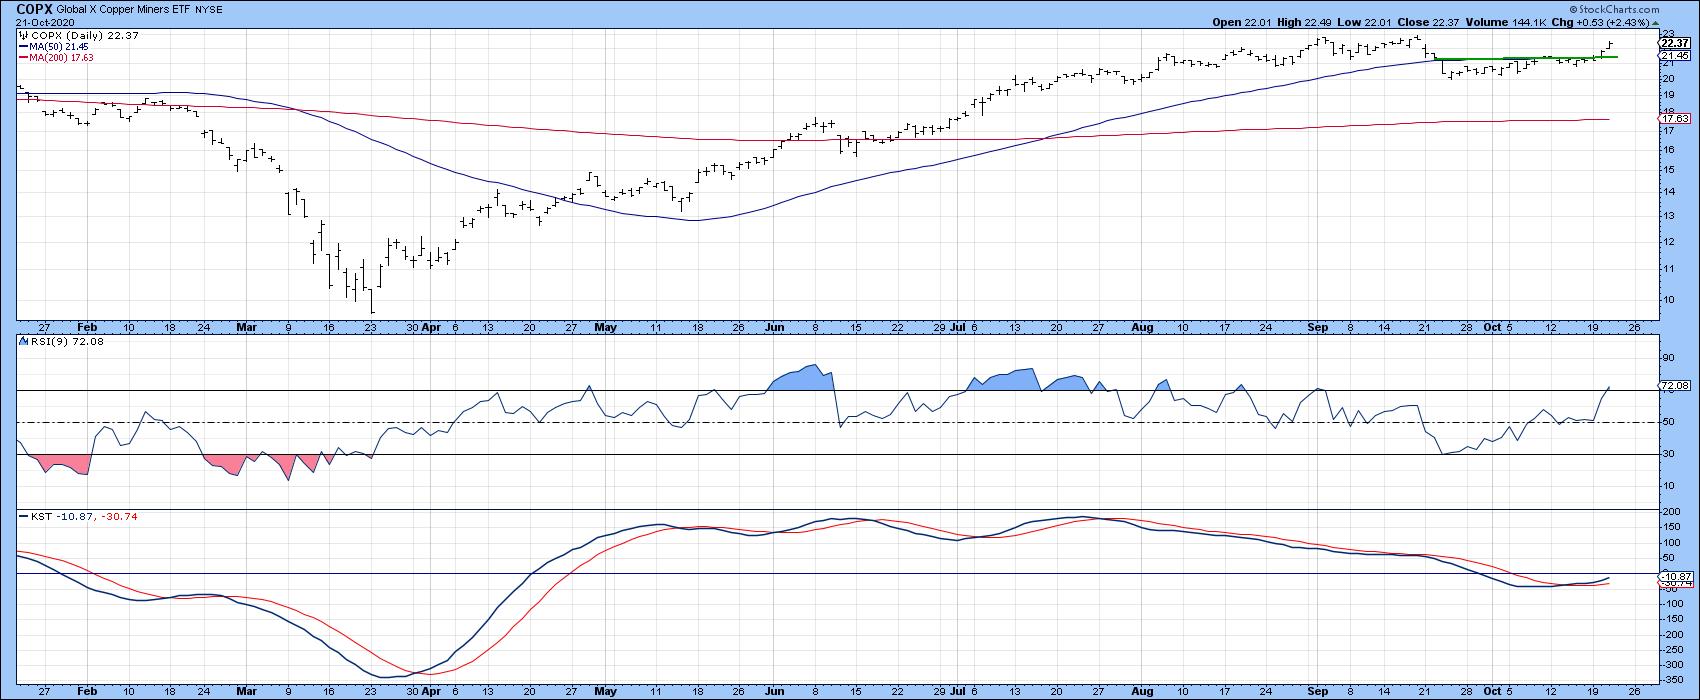 Chart 3
Chart 4 offers some longer-term perspective, with the absolute price and long-term KST in the upper two windows. The relative action of COPX is featured in the lower two windows. You can see that both KSTs have gone bullish and the absolute and relative lines have penetrated down trendlines, clearing their respective 65-week EMAs.
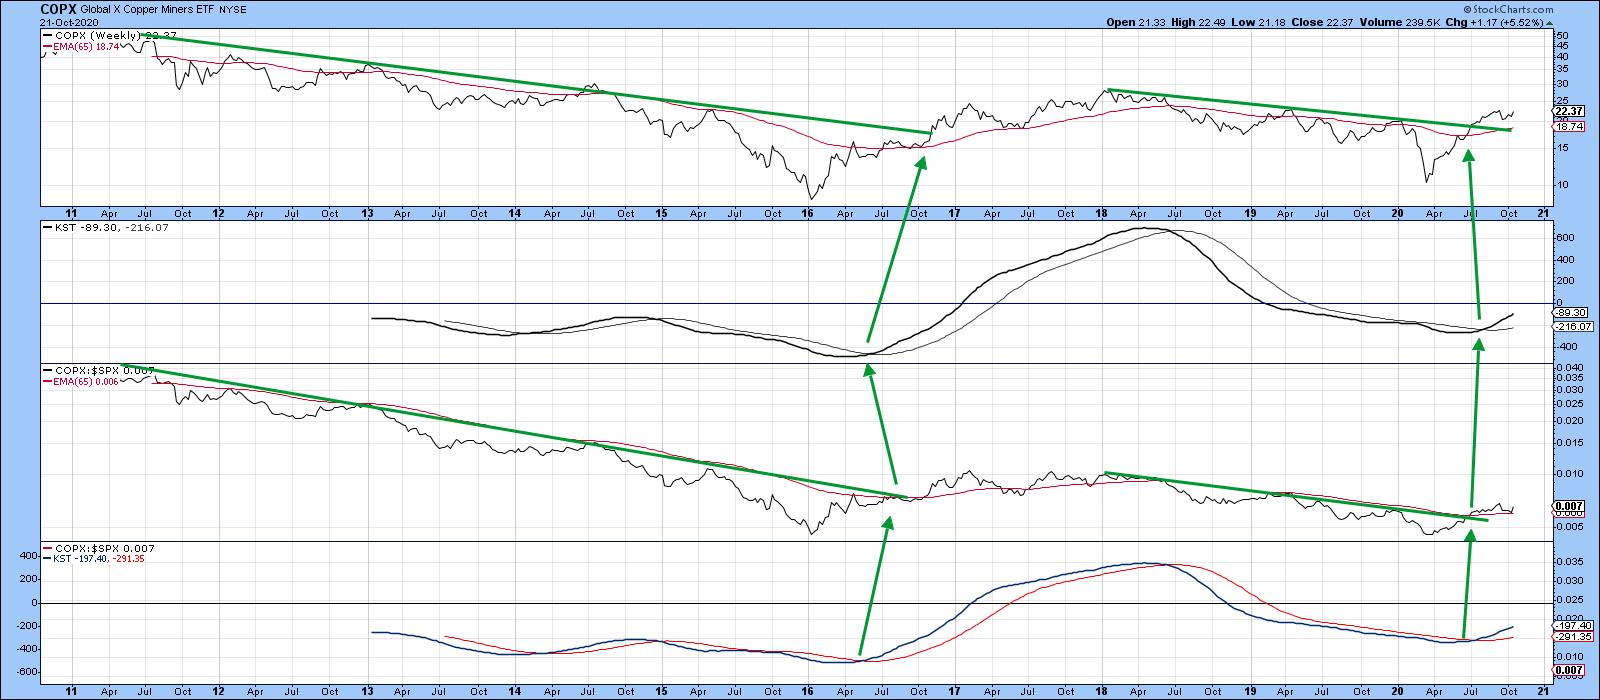 Chart 4
Given the close connection between the shares and copper price, as featured in Chart 5, it seems likely that copper will continue to work its way higher.
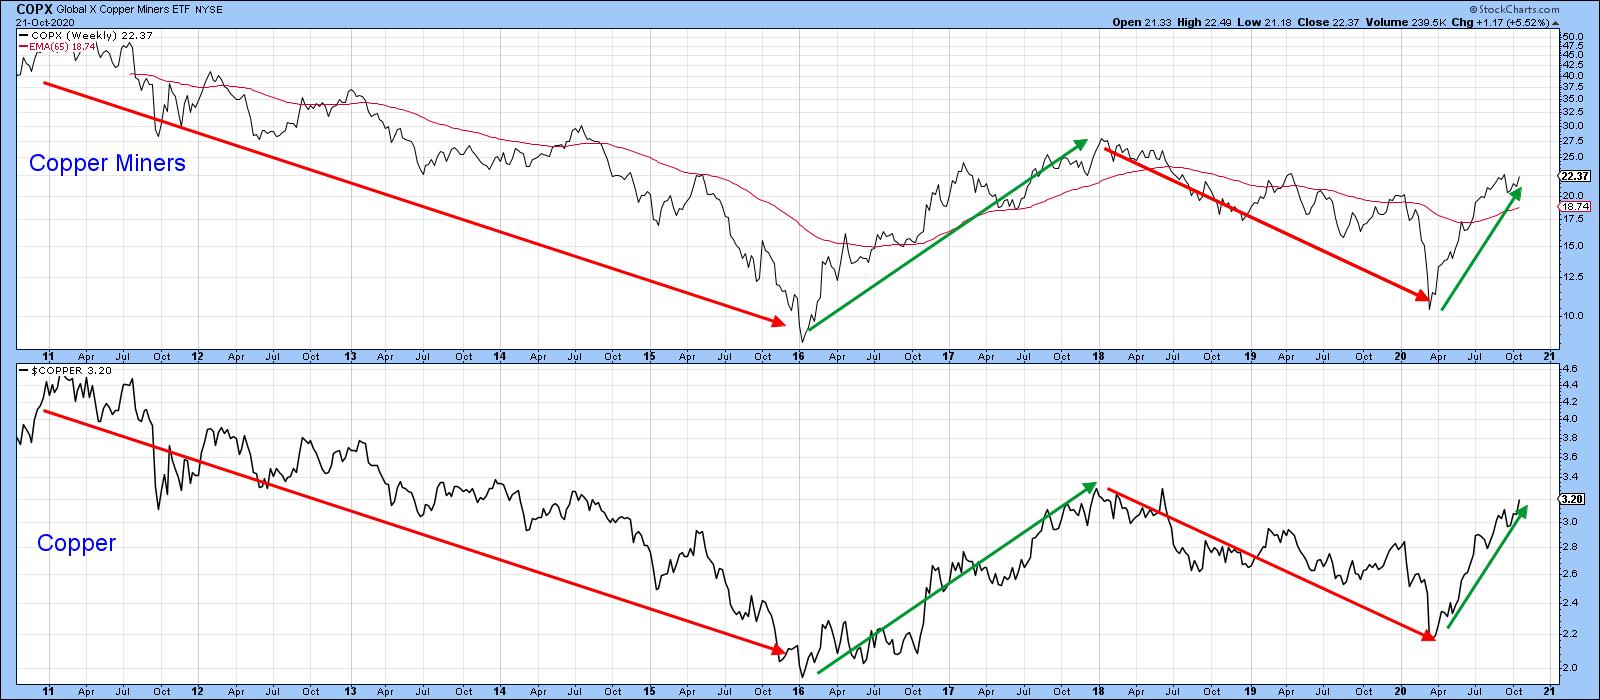 Chart 5
Copper may be one commodity, but Chart 8 indicates that swings in its price closely reflect those for the CRB Composite, a broad measure for the whole commodity market. Remember, commodity price trends are also a market-to-market economic indicator. The green-shaded areas tell us that, when the copper long-term KST is above its 9-month, it's typically bullish for the CRB. Two gray-shaded instances, in 1997 and 2006, warn us that this is not an infallible relationship. Even here, though, the CRB did not experience much of a drawdown.
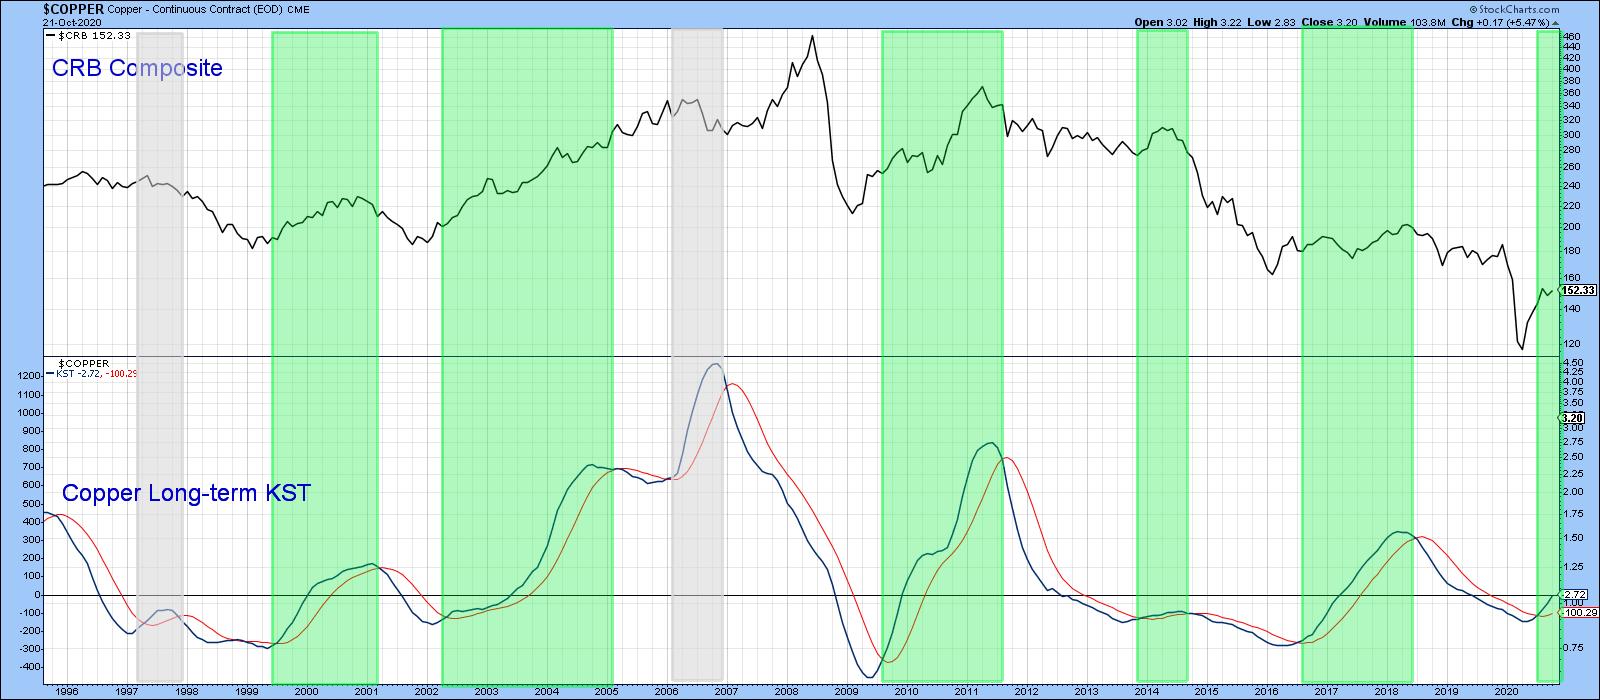 Chart 8
Editor's Note: This is an excerpt of an article originally published in Martin Pring's Market Roundup on Wednesday, October 23rd at 5:35pm ET. Click here to read the full article, which includes charts 6-7 and a discussion of the Chile Capped ETF (ECH) and its relation to copper.
Good luck and good charting
Martin J. Pring
The views expressed in this article are those of the author and do not necessarily reflect the position or opinion of Pring Turner Capital Group of Walnut Creek or its affiliates.


