I know it was a rough week last week; I only need to take one look at my own portfolio to figure that out. But the stock market doesn't go up in a straight line. There will ALWAYS be pullbacks. But be careful which "stories" you listen to.
The Reddit folks, as powerful as they may seem to be, won't take this market down. The stock market is much too big for a large number of smaller retail investors. Higher-than-normal PE ratios won't take this market down either. Rapidly-accelerating earnings growth in a very high GDP year with historically-low interest rates will keep a floor under stock prices. A short-term rise in treasury yields won't take this market down. There is a very strong positive correlation between the direction of treasury yields and the direction of the S&P 500. Rising yields mean that bonds are being SOLD, the proceeds of which are then available to drive equity prices higher. You need to ask yourself this question: Why would bonds be sold?
While that could depend on a number of factors, the common answer is the expectation of economic strength ahead. If the economy is expected to strengthen, the LAST thing you want to do is sell stocks. Yet we just saw the NASDAQ 100 ($NDX) tumble 4.94% last week, its second worst week since the bottom formed in March 2020.
There was one common denominator when looking at both weeks, however. They both occurred the week after options expired and during the historically-bearish calendar week of the 19th to 25th. Here are the S&P 500's historical daily returns by calendar day of the month:
- 19th: -33.69%
- 20th: -8.52%
- 21st: +3.23%
- 22nd: -11.07%
- 23rd: -5.14%
- 24th: -0.30%
- 25th: -6.58%
Considering that the S&P 500 has returned roughly 9% per year since 1950, the annualized returns above ALL fall below this average return. That's 7 consecutive calendar days of underperformance.
Given this information, now let's look back at those two bad weeks since the March low.
The NASDAQ 100 lost 4.94% from February 22nd through February 26th. The only worse week was October 22nd through October 26th. Those same calendar days did it again. One thing we have to at least consider is that much of this selling very well could be attributable to options expiration. Throw in profit-taking and fear-mongering by the media (rising yields) and the result was a 5% drop.
Instead of running scared after a much overdue pullback, how about we consider one of the biggest long-term truths relating to stock market performance?
The Dow Theory
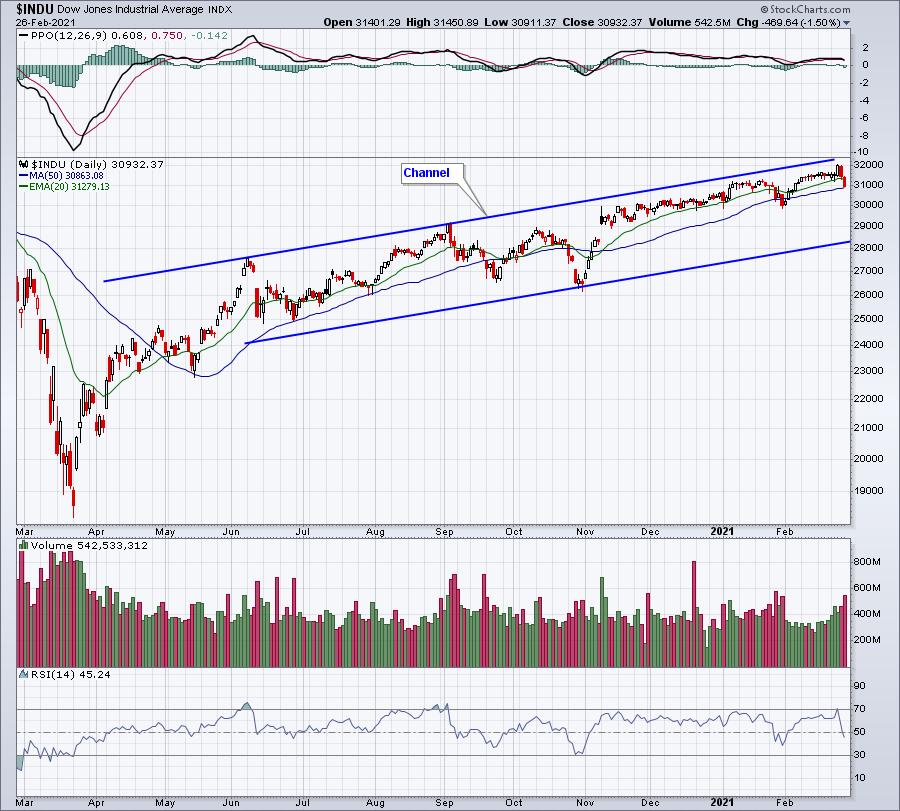
Charles Dow developed a very basic and fairly easy-to-follow approach to trading: the Dow Theory. It centered upon the theory that the stock market, as a whole, was a reliable measure of overall business conditions within the economy and that, by analyzing the overall market, one could accurately gauge those conditions and identify the direction of major market trends and the likely direction of individual stocks. A major part of the Dow Theory discusses the significance of indices confirming one another. Dow used the Dow Jones Industrial Average ($DJI) and Dow Jones Transportation Average ($TRAN) as two key indices to follow. Industrials would be a great way to assess economic activity and transports like railroads should profit from moving the freight. It's a very simple, yet brilliant approach to determining the sustainability of an uptrend, in my view.
Let's take a current look at these two indices:
Dow Jones Industrial Average ($DJI):
Dow Jones Transportation Average ($TRAN):
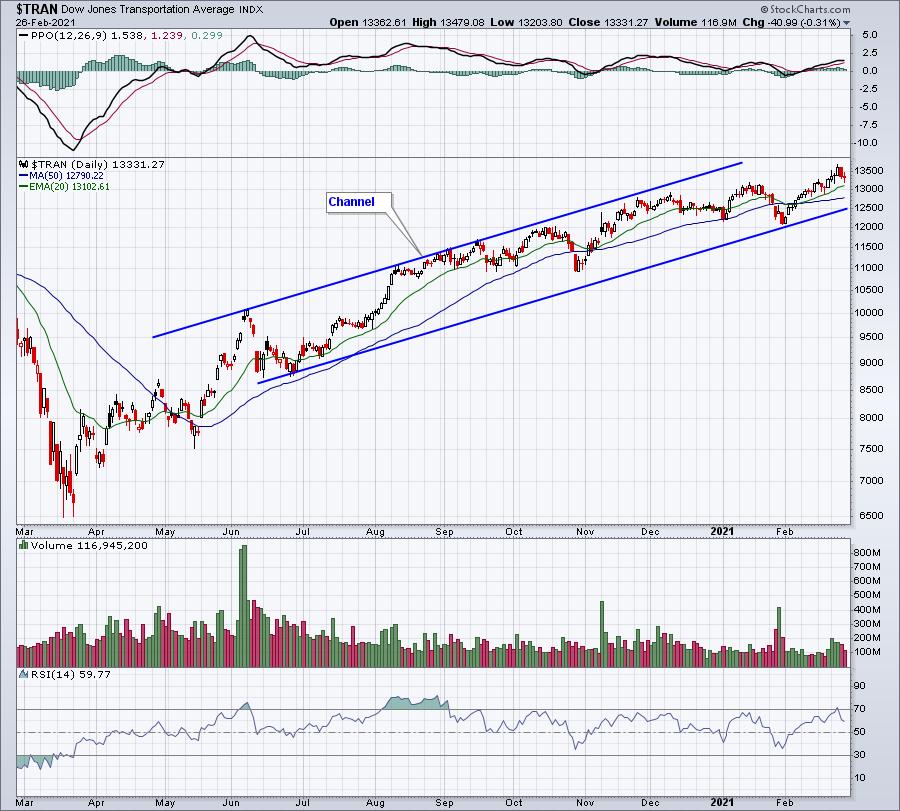
Both are channeling higher and both set all-time highs on Wednesday of this week. I believe they both reflect the likelihood that our economy will expand rapidly in the second half of 2021. Therefore, buying U.S. equities during pullbacks makes very good sense to me.
I'll be focusing on companies poised to take advantage of a strengthening economy in our 3x per week EB Digest newsletter. It's completely free with no credit card required. If you'd like to join our growing community of knowledgeable traders, simply CLICK HERE to provide your name and email address.
Happy trading!
Tom


