
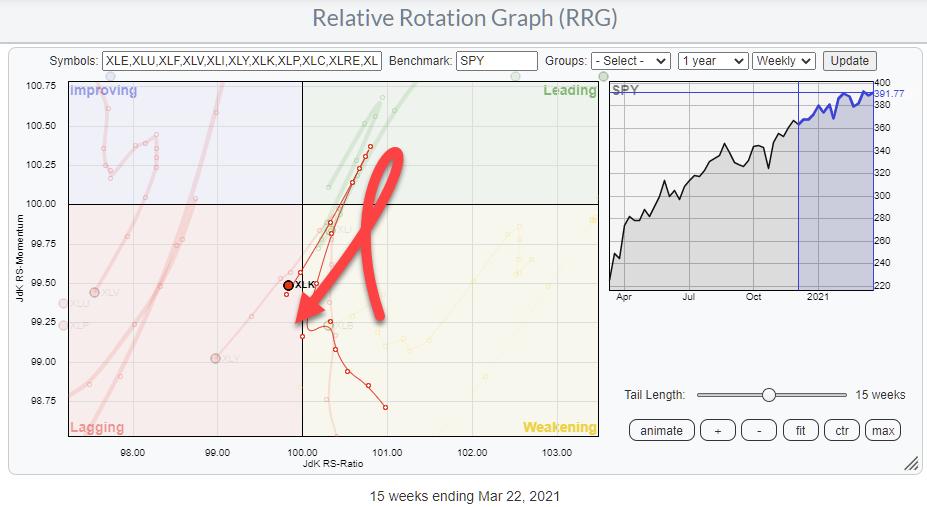
There is no doubt about it; Tech(nology) is an important sector. As a matter of fact, it is a crucial sector. At 26% weight inside the S&P 500 index, technology is twice as big as the next biggest sector -- Health Care at 13% -- and number three, Consumer Discretionary, which has a weight of 12.4%. Or in other words, Tech alone is as big as Health Care and Discretionary combined.
So if Tech becomes a drag, that's serious, and it could have, or better will very likely have, an impact on the market in general.
Let's talk about the weight in sectors. We'll zoom in on these three top sectors in the S&P 500:
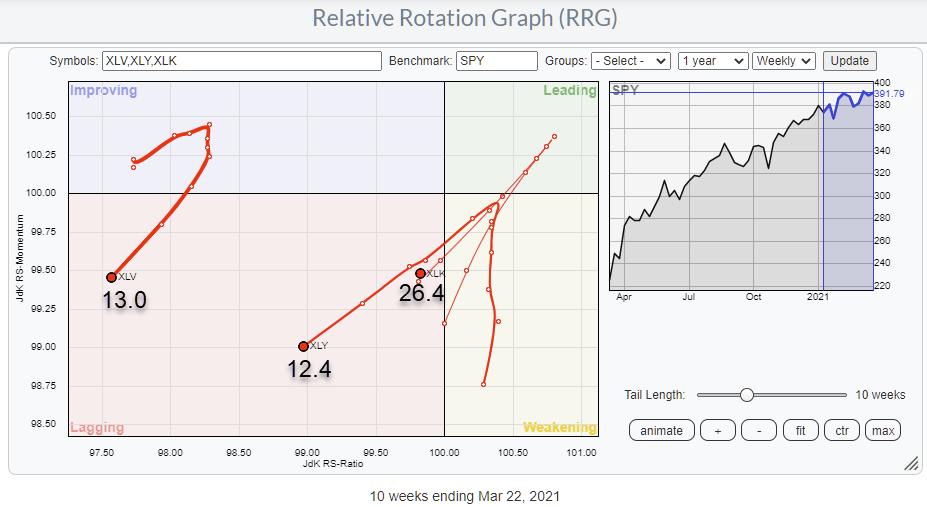
All three, with a combined weight > 50%, are negatively affecting the S&P 500.
The next RRG shows the tails for XLRE, XLC, XLI, XLF and XLE, which are all (more or less) pulling the market (SPY) in a positive direction.
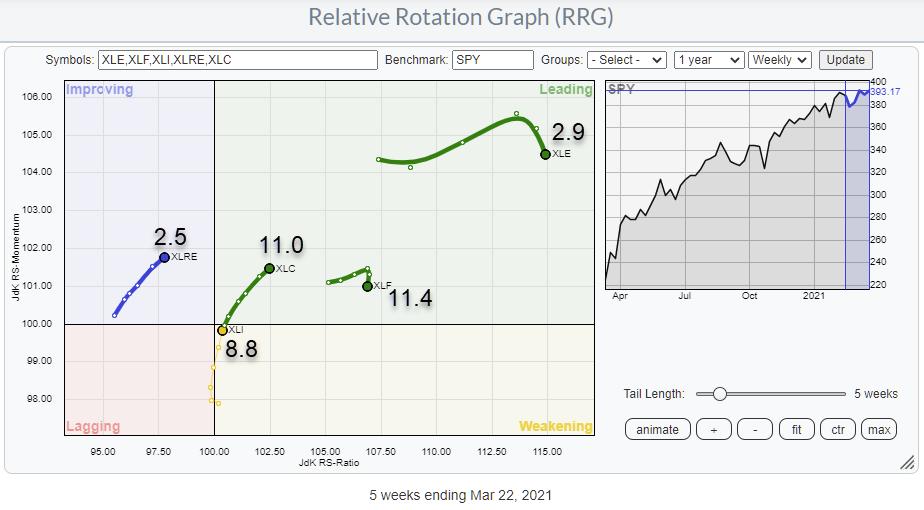
The combined weight for these sectors is just below 37%, including Energy and Financials, which have already started to roll over (i.e., losing relative strength). If we leave out XLF and XLE, only just over 20% positive pull remains. With such an imbalance, it will be tough for SPY to continue its rise at the pace we have seen recently.
Just to be clear, the long-term trend for SPY is still up. But the current rotation and, in particular, the rotation of these top-three heavyweight sectors seems to be putting the brakes on the acceleration for now. Whether it will become a more serious decline or just a small or sideways correction remains to be seen. IMHO, it's too early to tell, but I will keep a closer eye on the rotation of these top-three sectors.
When tech is a "drag," it's very hard for the market to move seriously higher. We need a lot of power in other sectors to offset a weak technology sector's negative effects. When the top-three sectors are negatively affecting the market, I think it should be seen, at the minimum, as a warning signal.
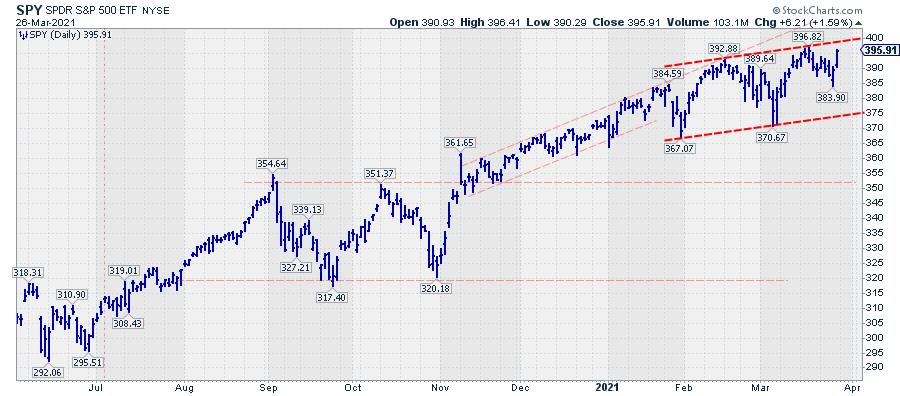
It fits, at least in my mind ;) , the current change in the angle of the rise for the S&P 500. From November until late January, the rally traced out a regular rhythm of higher highs and higher lows. That series got interrupted by the drop at the end of the month. From there onwards, the swings got wider, which equals uncertainty, and the angle of the trend seems to have flattened.
I will be the first to admit that trend-lines with only two touch-points (the two bright red dashed lines) are as good as useless. So I won't label them as support or resistance, at least not yet. But I do think that the slope's decreasing angle signals that sellers seem to be getting a bit more aggressive than they had been since September-November last year.
What Do We Need to Get (Tech) Back on Track?
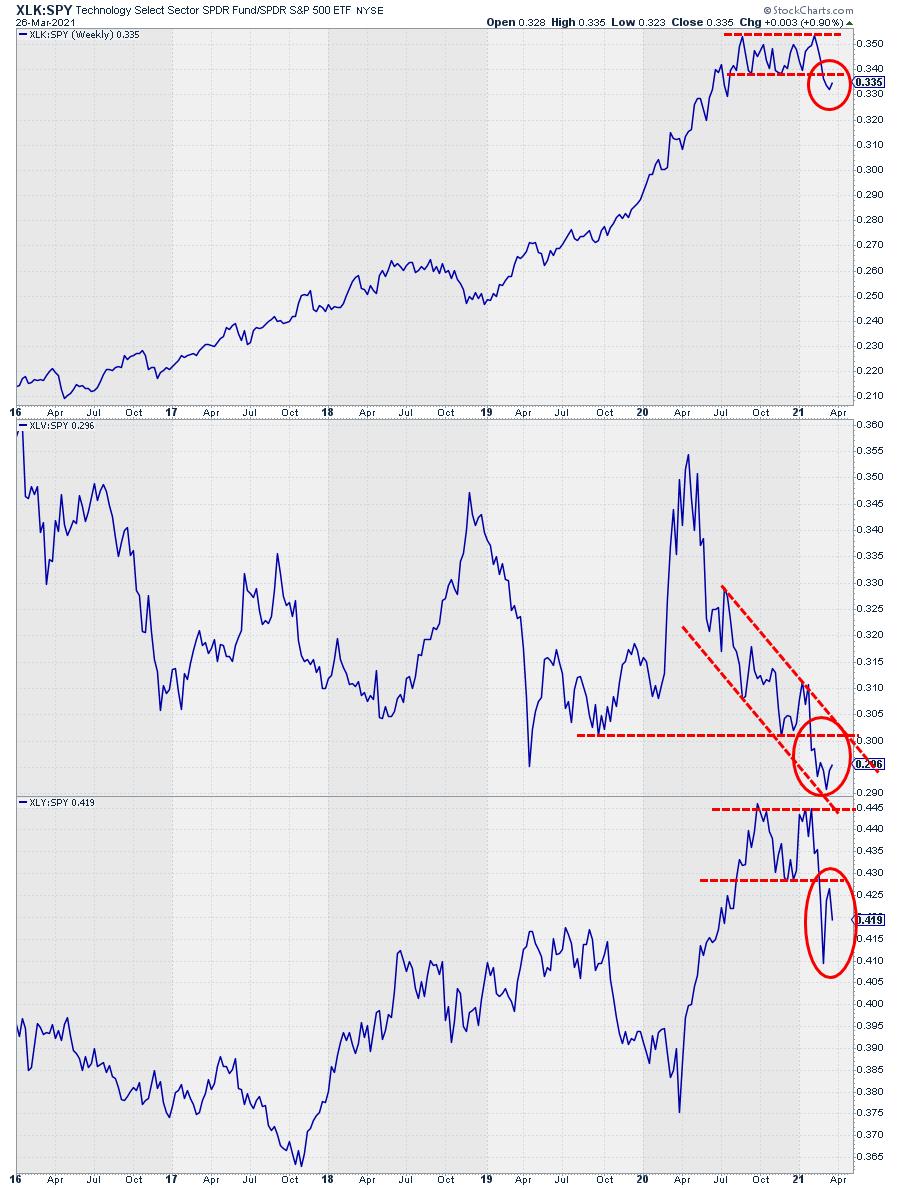
The chart above shows the relative strength lines of the top-three sectors vs. SPY. Pretty clear (further) weakening is visible in all three, I think. Technology dropped out of a sideways pattern after a steep rise. Health Care dropped to new lows, continuing the relative downtrend in play for almost a year. Discretionary completed a text-book double top, including a pull-back to the breakout level.
What do we need to get this train back on track? I would like to see at least two, but preferably all three, of these sectors get into a relative uptrend again, creating a positive pull.
My regular blog is the RRG Charts blog. If you would like to receive a notification when a new article is published there, simply "Subscribe" with your email address.
Julius de Kempenaer
Senior Technical Analyst, StockCharts.com
Creator, Relative Rotation Graphs
Founder, RRG Research
Host of: Sector Spotlight
Please find my handles for social media channels under the Bio below.
Feedback, comments or questions are welcome at Juliusdk@stockcharts.com. I cannot promise to respond to each and every message, but I will certainly read them and, where reasonably possible, use the feedback and comments or answer questions.
To discuss RRG with me on S.C.A.N., tag me using the handle Julius_RRG.
RRG, Relative Rotation Graphs, JdK RS-Ratio, and JdK RS-Momentum are registered trademarks of RRG Research.


