DecisionPoint employs "Climax Analysis" -- and only DecisionPoint.com has it. Determination of "climax days" is invaluable for the short-term trader. We've found that, by analyzing Net Advances-Declines, the VIX, Total Volume and Volume Ratios, we get excellent signals on what to expect over the next day or two of trading. Often, these climaxes will mark the beginning of a longer-term rally or decline as well, which we confirm with our other indicators. Mainly, it keeps you "in the know" on upcoming pivot points. Climax analysis is part of our DecisionPoint Alert report.
This week we had two "climax days" -- yesterday and today. Let's look at each using our "Climax Chart" below. We look for "outside" indicator days, those being days which show a spike or movement outside our thresholds. Sometimes, we get elevated readings that are not quite outside the lines. So how do we confirm these climax days? We use Volume Ratios for the NYSE and SPX.
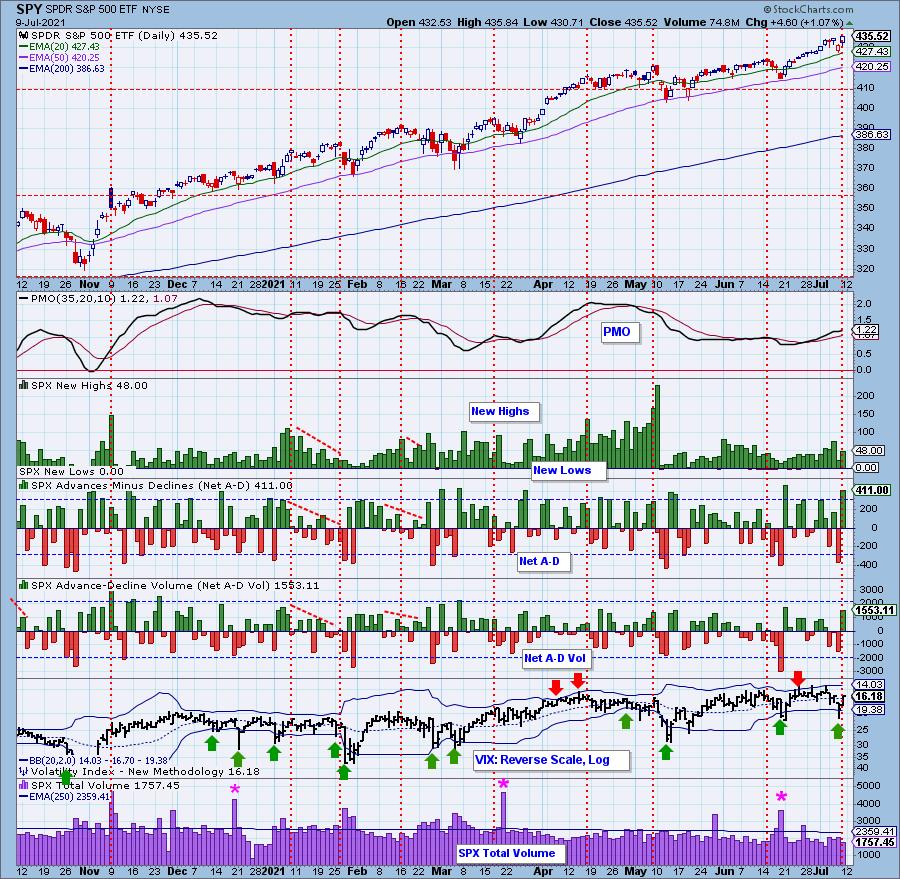
Let's look at yesterday first. You'll notice that readings yesterday were quite elevated to the downside. Net A-D was outside our climax threshold, but Net A-D Volume was not. It was still a high negative reading, so that sufficed. Note that the VIX moved below the lower Bollinger Band on our inverted scale. Typically, a puncture of the lower Band leads to a rally over the next day or two. There was also elevated Total Volume. This was a "Downside Exhaustion Climax" or selling exhaustion. The expectation was a rally or at least consolidation to follow. It turned out to be prescient, as today we saw a strong market rally.
Today, we have climactic readings to the upside or an "Upside Initiation Climax". We saw an expansion in New Highs, Net A-D had an "outside" day and Net A-D Volume was elevated. The VIX moved back above its EMA on the inverted scale. Now, it is time to look for confirmation on the Volume Ratio charts.
A side note: we invert our VIX because we view punctures of the Bands as a sign of oversold or overbought conditions. Overbought is when investors are too complacent and Oversold is when investors are too nervous, hence we invert. We also use a log scale so we can see all movement more clearly.
Our Sale Ends July 15th!
Get 50% off your first month on any of our subscriptions by using the coupon code: SAVE50

A note on Volume Ratio analysis: NYSE Up/Down and Down/Up volume ratios are also climax detectors. The 9:1 ratio suggested by the late Dr. Martin Zweig in his book, Winning on Wall Street, is especially significant, but we primarily look for spikes outside the normal range to clarify a particular event. We have an NYSE and S&P 500 version of the ratios, and normally they will only be published when there is a notable reading.
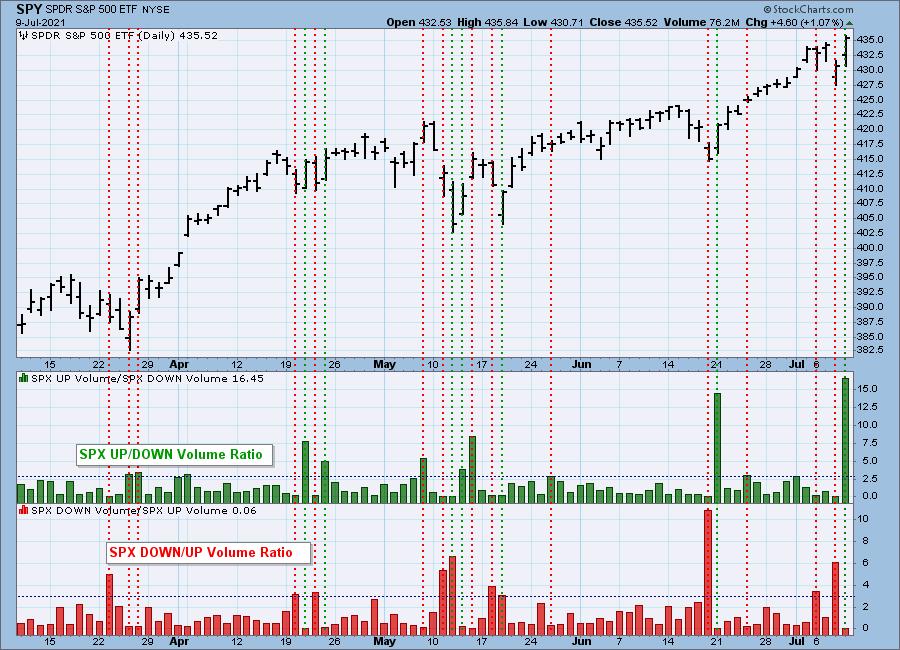
Let's see if we have confirmation of yesterday's and today's "climax days." Yesterday, the Down/Up Volume Ratios for both the NYSE and SPX were above our climactic threshold of 3.0. That confirmed yesterday's downside exhaustion climax. Today, we saw upside initiation climax confirmation on the Up/Down Volume Ratios for both the NYSE and SPX.
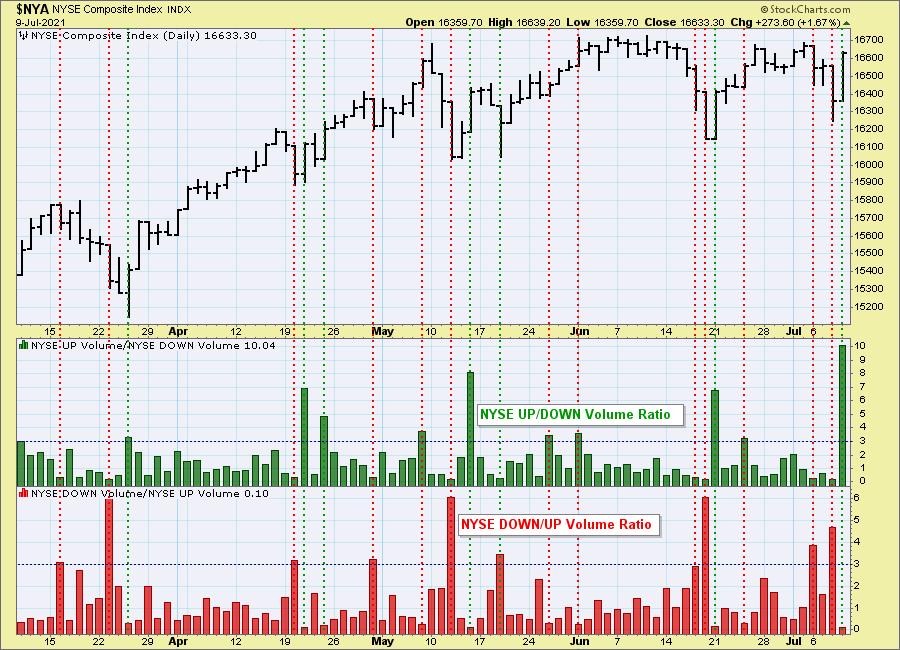
The S&P 500 version can get different results than the NYSE version because (a) there are only 500 stocks versus a few thousand and (b) those 500 stocks are all large-cap stocks that tend to move with more uniformity.
The question remains: how do we determine if it is an "initiation" or "exhaustion" climax? That's a bit tricky as it isn't always cut and dried. Typically, we look at the trend that preceded the climax. If it seems to be ending a trend, it is considered an "exhaustion", whereas if it is a reversal of a trend, it is considered an "initiation".
Read our conclusion below regarding today's upside initiation climax.
It's FREE! Learn how Erin trades in the free DecisionPoint Trading Room Mondays at Noon ET. Recordings are sent to all registrants!

Click here to register in advance for the recurring free DecisionPoint Trading Room! Recordings are available!

CONCLUSION: Climax analysis is exclusive to DecisionPoint. DecisionPoint Alert subscribers are notified immediately if we see a climax day. Additionally, we look at our other DecisionPoint indicators to confirm climaxes or see if the climaxes will lead to more rally or more decline in the short- to intermediate-term. Today's readings suggest an upside initiation climax. We should expect higher prices, or at least some consolidation, rather than a big decline to begin next week.
Our special is ending next week on July 15th! Take advantage by using coupon code: SAVE50 to get 50% off your first month on all of our subscriptions.
Technical Analysis is a windsock, not a crystal ball.
--Erin Swenlin
(c) Copyright 2021 DecisionPoint.com
Helpful DecisionPoint Links:
DecisionPoint Alert Chart List
DecisionPoint Golden Cross/Silver Cross Index Chart List
DecisionPoint Sector Chart List
Price Momentum Oscillator (PMO)
Swenlin Trading Oscillators (STO-B and STO-V)
DecisionPoint is not a registered investment advisor. Investment and trading decisions are solely your responsibility. DecisionPoint newsletters, blogs or website materials should NOT be interpreted as a recommendation or solicitation to buy or sell any security or to take any specific action.


