As the S&P 500 and Nasdaq 100 indexes have pounded away at new all-time highs basically every month in 2021, investors are left to wonder when a correction may actually be coming. We were taught that markets don't just go straight up, but instead they move in a series of impulse moves and corrective reactions as the overall trend continues. But 2021 has very much been the exception to that rule of market trends!
Underneath the hood, however, the picture has indeed been evolving. As the S&P pushed up to new highs in late June into July, the advance-decline lines for the NYSE, as well as the small cap index, did not confirm those new highs.
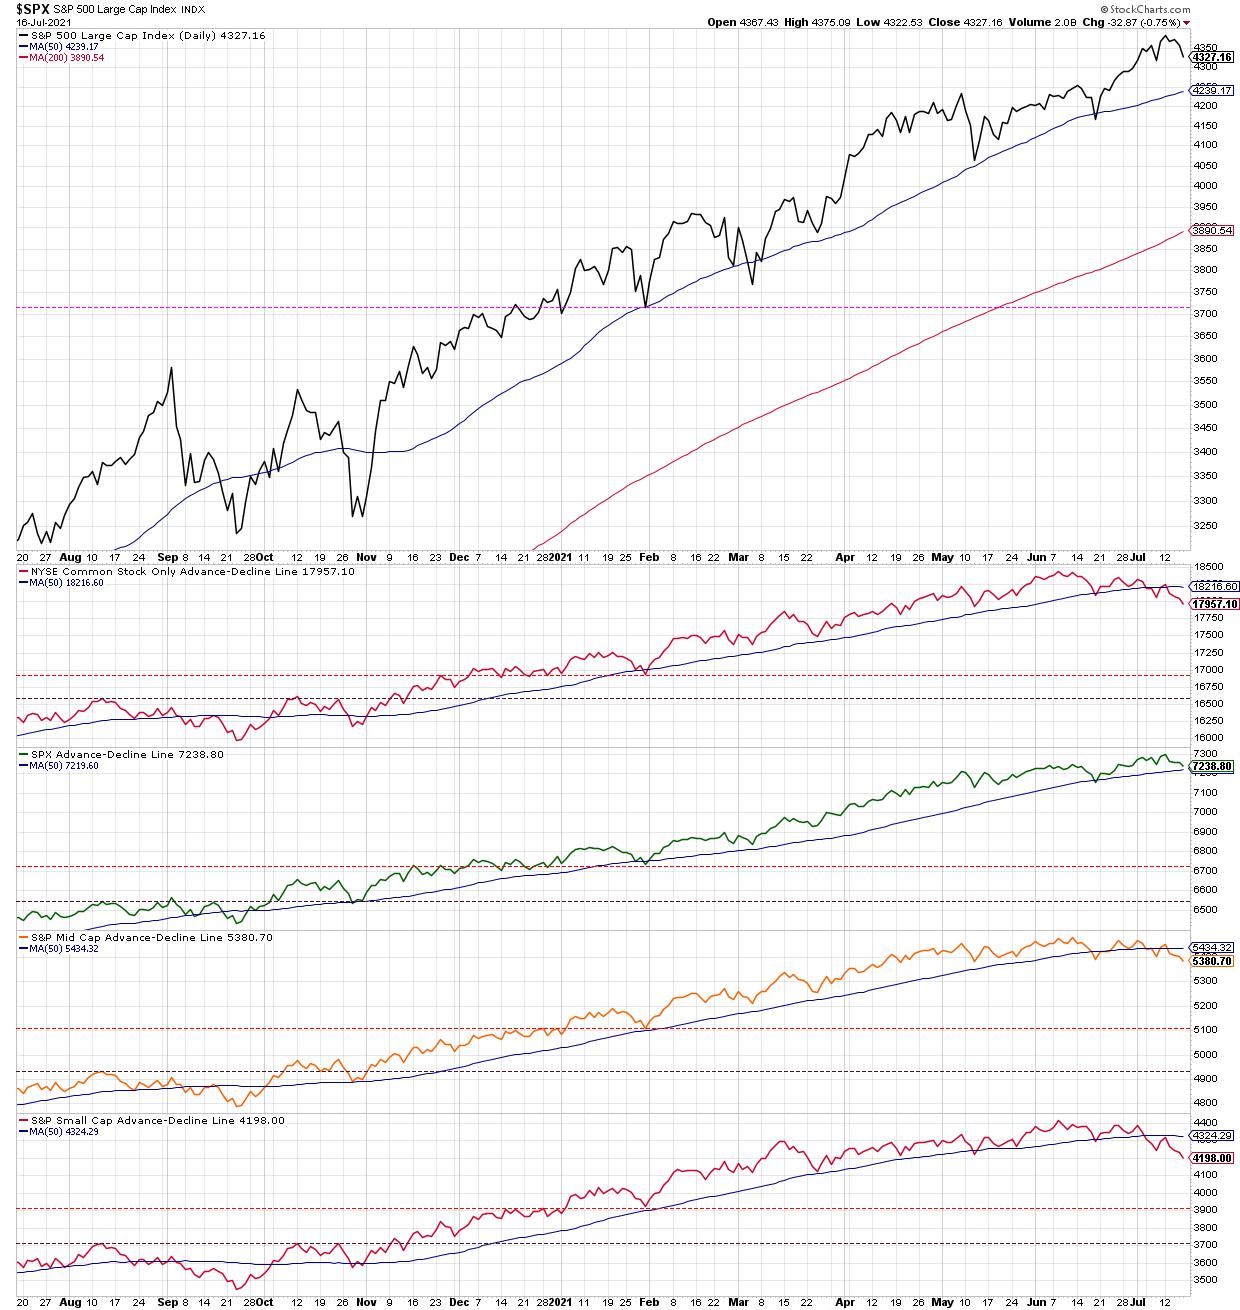
This week, we saw further downside confirmation when both of those A-D lines broke below their 50-day moving averages and made new swing lows. This suggests a sort of "stealth correction" where the major averages are moving higher but the conditions underlying that uptrend are much more corrective.
Join me on Tuesday July 20th at 1:00pm ET for a FREE webinar entitled "The Market Top Checklist"! We'll review previous bull market tops and discuss the conditions to watch for given the current market uncertainty. Sign up HERE for this free virtual event!
So now that we have bearish breadth divergences, what happens next?
Markets can actually correct in three ways: a price correction, a time correction and a stealth correction. Let's briefly review each of these corrective patterns using the chart of the S&P 500 index.
I should note that, while many media outlets like to use specific percentage moves to define a pullback vs. correction vs. bear market, I tend to feel the trend, momentum and support/resistance levels are much more important than the label. So I tend to classify a smaller downturn as a pullback, a deeper downturn as a correction and a complete rotation to risk-off as a bear market!
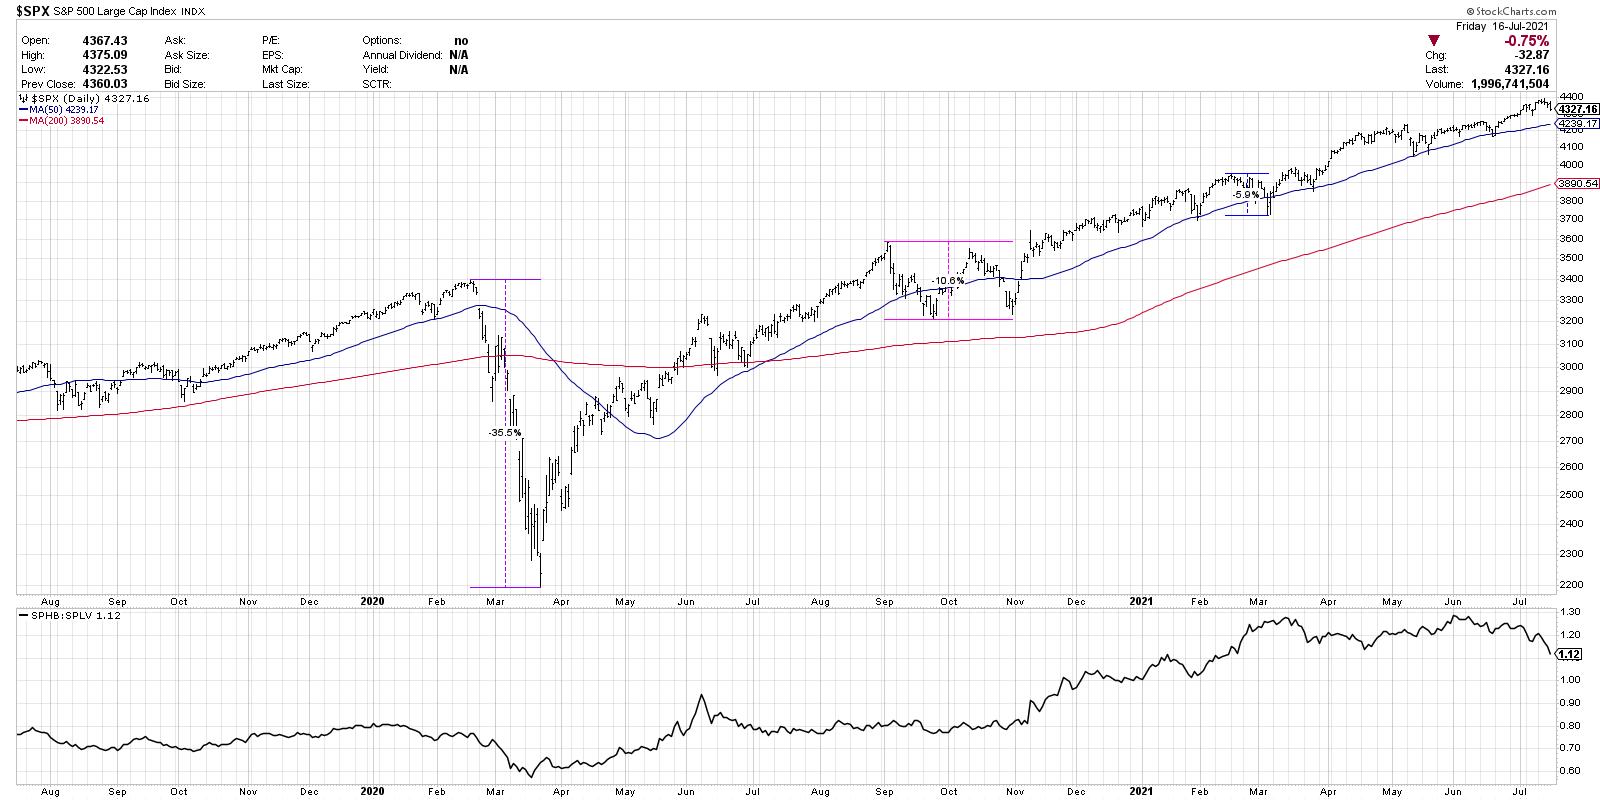
February-March 2020 provides a good example of a price correction. The S&P lost about 35% of its value in just over one month. Remember how quickly the bottom reverted back to the upside, giving the chart its classic V shape? That's what a price correction often looks like.
By mid-April, the S&P was back in uptrend mode, making higher highs and higher lows. The higher April low was a key indication that the price correction was over and the bull phase had resumed.
For a time correction, check out September-October 2020. You can see that the market only pulled back above 10%, but it was a shallower and wider correction than in February-March. A time correction involves less pain price-wise, but tends to be longer and more drawn out. Time corrections are when the market essentially goes sideways, trading around an equilibrium price.
Finally, we have a stealth correction, which I would argue we've been in for a while now. While the indexes move higher, many stocks and groups are already breaking down. Stocks that break out often fail, indicating a lack of willing buyers to push prices onward and ever upward. Stealth corrections are tricky because many stocks are still going higher, which can create a sense of overconfidence for investors who believe the market can go only one direction: up.
I added one series to the bottom of the S&P 500 chart, which is the ratio of high beta to low volatility stocks (using the SPHB and SPLV ETFs). Note that, since mid-February, this ratio has essentially been rangebound. This illustrates how the markets have truly been in leadership rotation mode, with offense and defense-oriented sectors taking turns in the driver's seat.
So now that we have defined the three types of corrections, what could we expect now, given the weakened breadth conditions and clear indications of risk-off this week? That is to say, if we do see a downside follow through next week and beyond, what might a correction look like?
Scenario 1: Down 8% to May lows
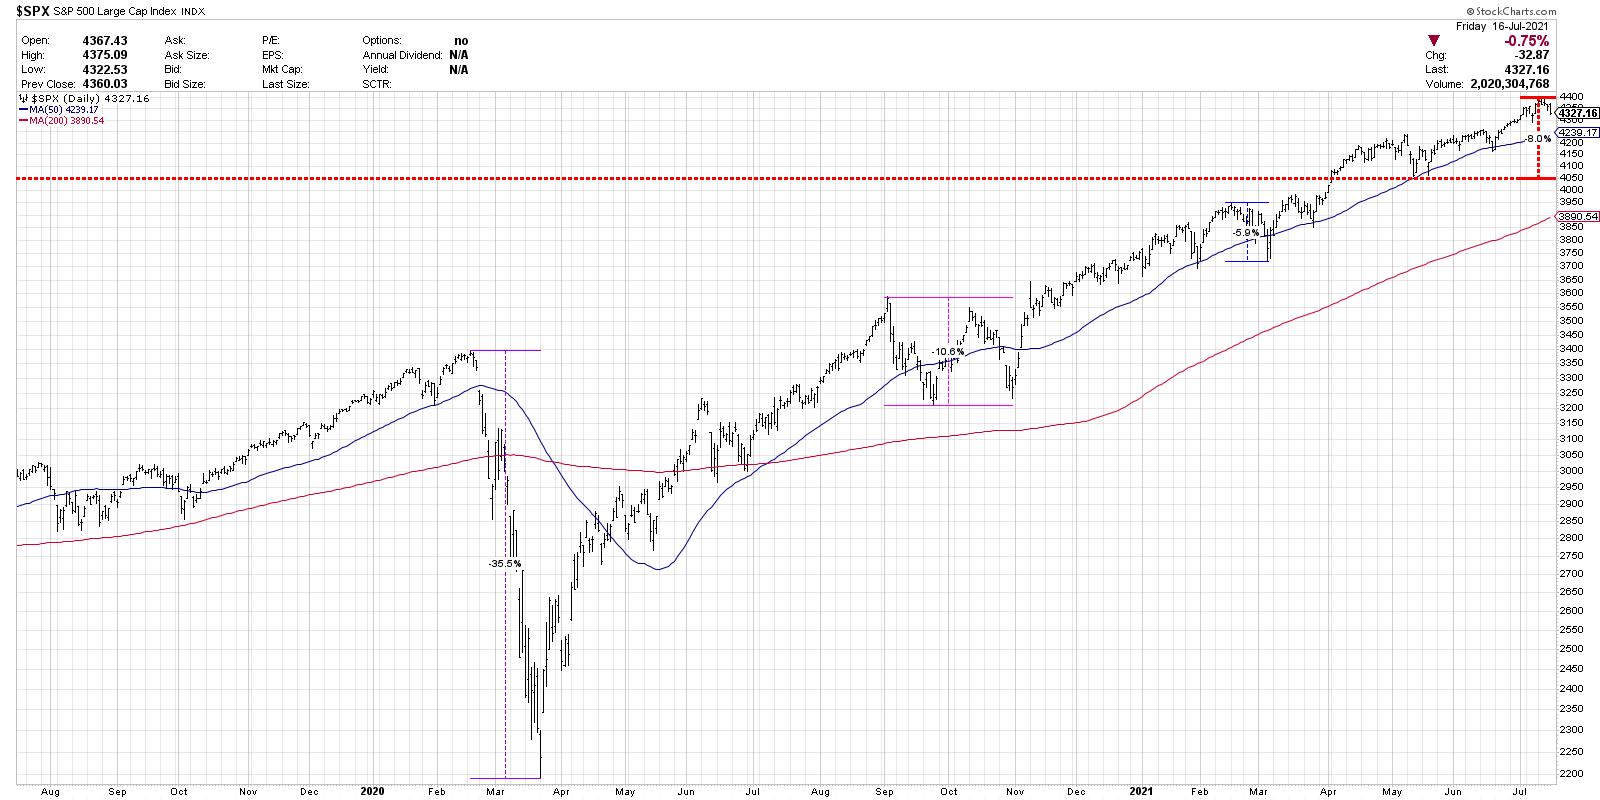
In this first scenario, the S&P comes down about 8% off the highs (another 6.5% below current levels) to retest the price lows from May. Many of my guests on The Final Bar recently have pointed to this key level of support. As long as the S&P remains above this level, one could argue that the long-term bull phase is still intact. This would mean the deepest correction thus far in 2021, although, compared to previous bull markets, it's not that out of the question. Think about how cyclicals, which have already pulled back from recent highs, would likely continue their drop in this scenario.
Scenario 2: Down 11% to 200-day moving average
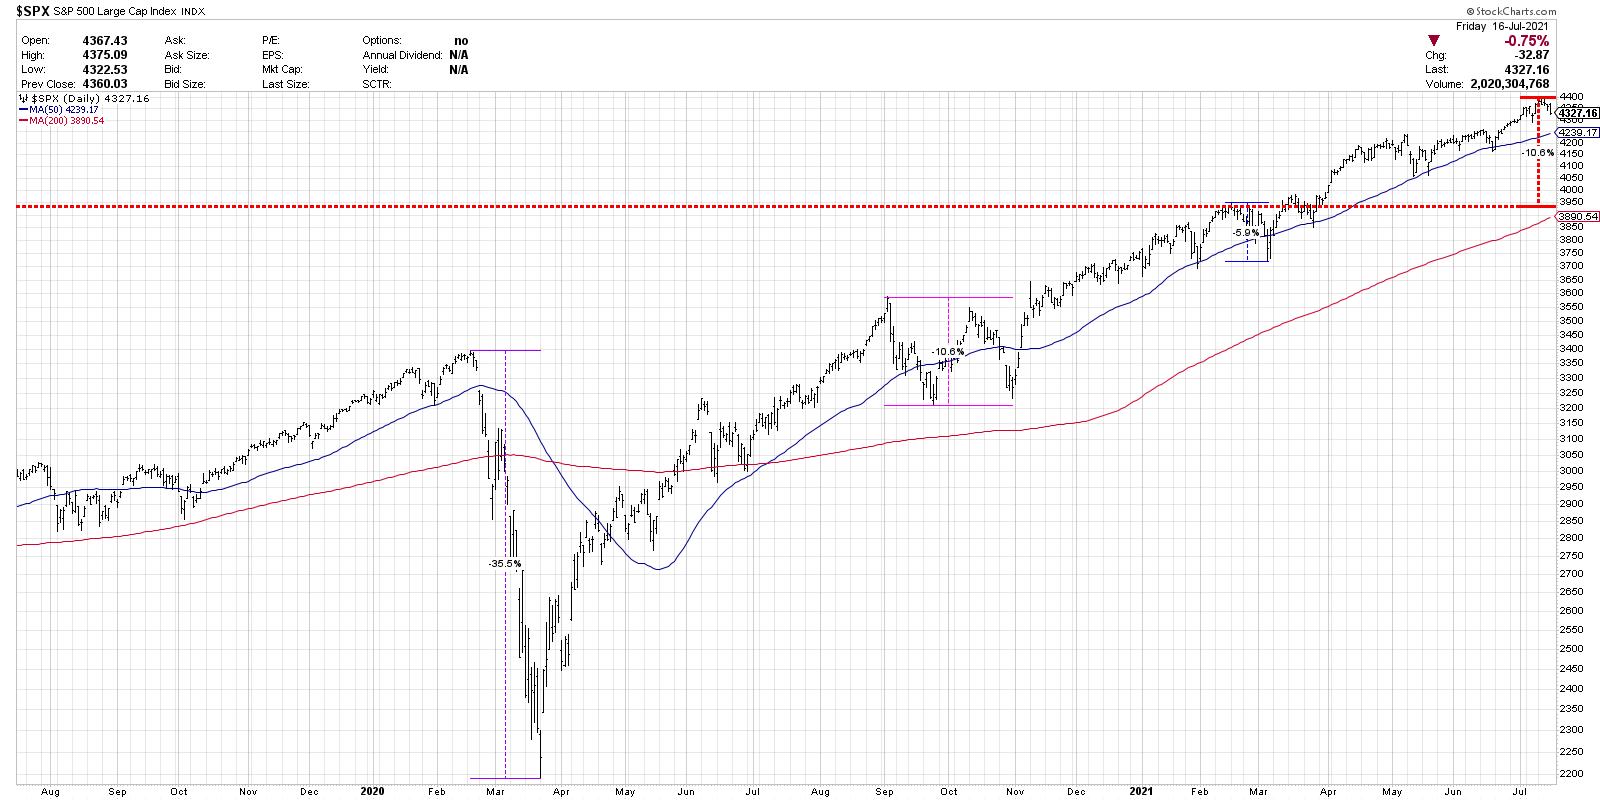
But perhaps the S&P fails to hold support at the May low? In breaking below 4050, many strategists (including most likely yours truly) call for a much more drawn-out bear phase. But, instead of going full bear market, the S&P simply goes down another 3-4 percent, reaching the 200-day moving average for the first time since June 2020.
Investors start to think defensively and consider the possibility of a retest of the March lows, but the S&P instead finds support at the 200-day and provides enough buying power to establish a new base, propelling the equity markets to finish even higher by year end.
Scenario 3: Down 35% as 2020 selloff repeats
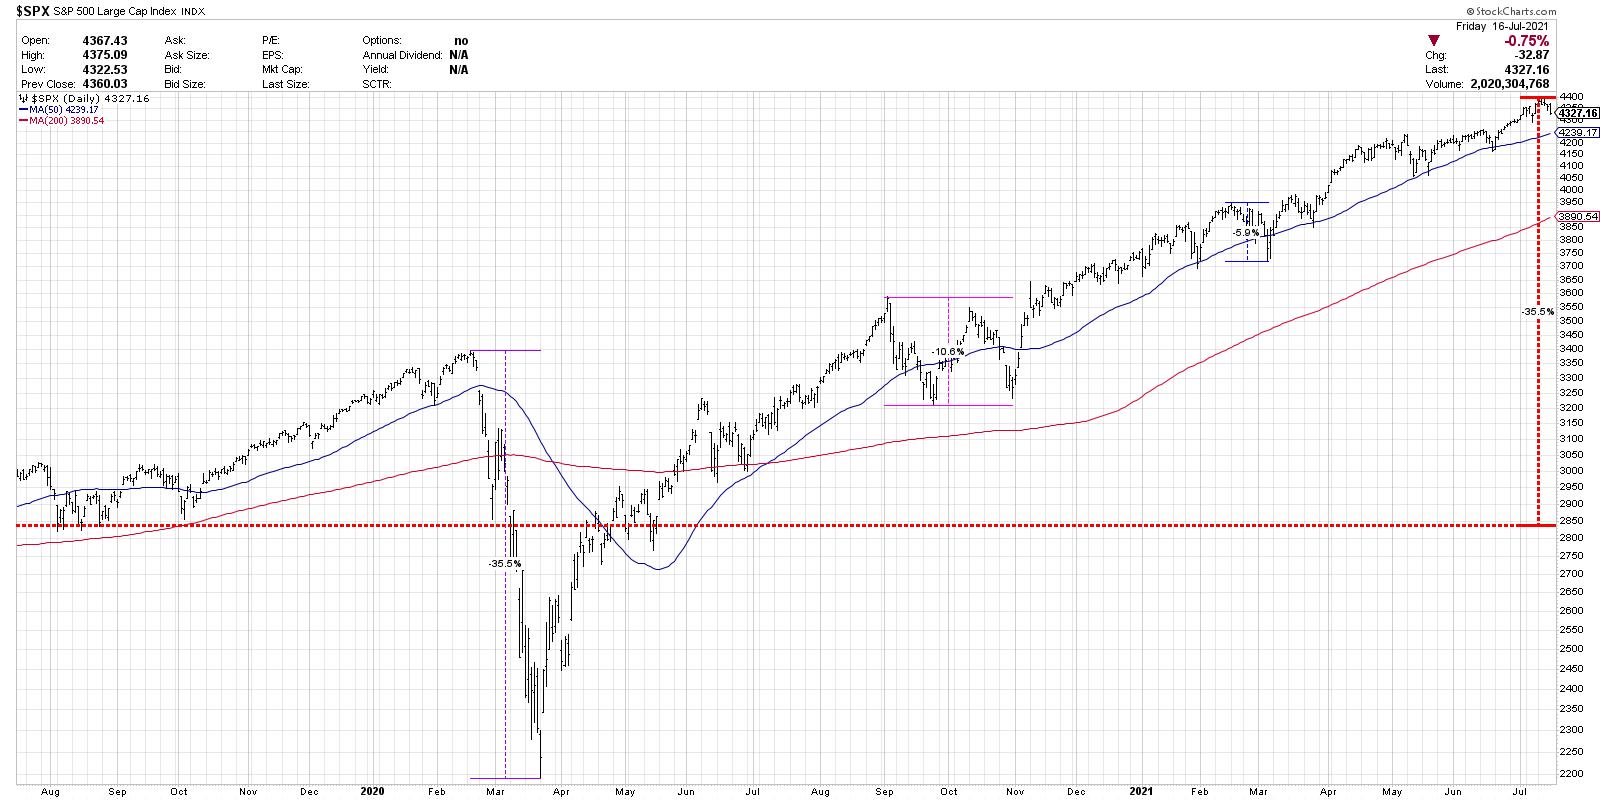
This is definitely a worse-case scenario, with the argument being that, if the S&P can't hold the May lows and then fails at the 200-day moving average, enough damage will be done that investors become despondent.
I would consider this a highly unlikely scenario, given economic conditions and the strength of the bull market in the first half of 2021. There would need to be some new catalyst that would create the conditions to propel the S&P that far down.
However, I learned over my career to always consider the alternative scenarios. What would happen in a 35% drop? How would the FAANG stocks, who have led the most recent up move in stocks, react to that sort of negativity? What would happen to gold? Could cryptocurrencies emerge as a "safe haven" of sorts, or would investors flock to fixed income and create a new bull market in bonds?
So there are three potential outcomes given an S&P correcting further next week. Given the internal weakness and breadth divergences, a pullback seems likely. The question is how far, how long.
The most important question is, how will you manage risk in that environment?
To digest this article in video format, check out my YouTube channel:
RR#6,
Dave
P.S. Ready to upgrade your investment process? Check out my free course on behavioral investing!
David Keller, CMT
Chief Market Strategist
StockCharts.com
Disclaimer: This blog is for educational purposes only and should not be construed as financial advice. The ideas and strategies should never be used without first assessing your own personal and financial situation or without consulting a financial professional.
The author does not have a position in mentioned securities at the time of publication. Any opinions expressed herein are solely those of the author, and do not in any way represent the views or opinions of any other person or entity.


