Chart 1 shows that the US stock market is in a long-term uptrend relative to the rest of the world. The upper window compares the S&P to the Vanguard All-World ex-US ETF and indicates a recent breakout from a consolidation reverse head-and-shoulders. The lower panel substitutes the S&P Equal Weight ETF; it, too, is in an uptrend against the rest of the world.
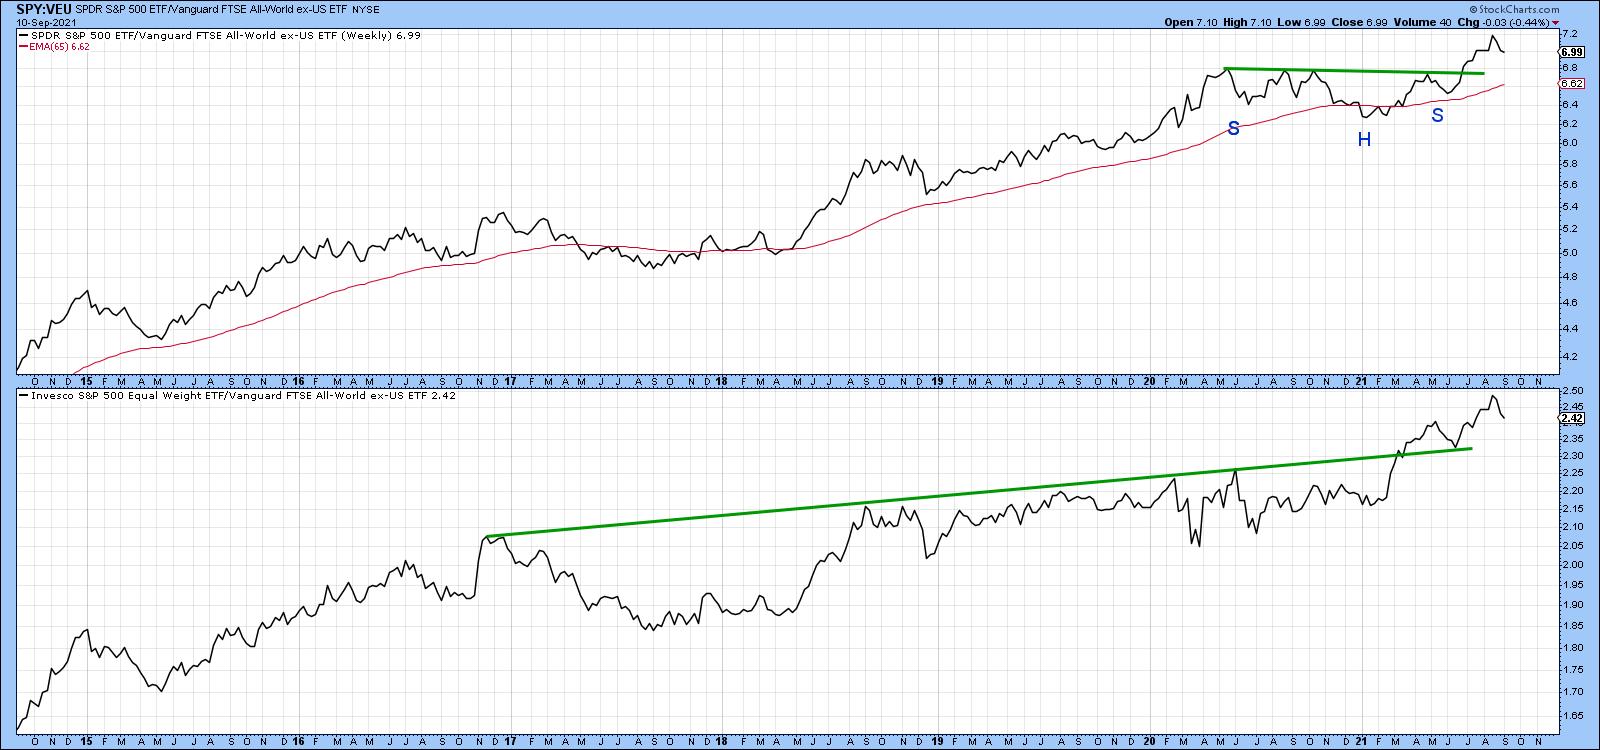 Chart 1
You may be asking the question, "If the US is the place to be, why look at anything else?" The answer lies in the fact that individual country ETFs, like sectors, are continually rotating in popularity amongst investors and traders. Since there are always new ones emerging or fading, the point of this article is to draw your attention to some interesting funds that may be about to emerge. In that respect, I am really referring to relative action, as the vast majority of country ETFs are already in established uptrends from an absolute price aspect. Consequently, we can refer to these ETFs as relative sleepers, which are positioned to potentially take over from the US leadership in the event that it should start to falter.
Israel
Israel is a great example of this positive absolute/weak-but-stabilizing RS combination, as the price has clearly managed to break above its 2014-2020 resistance trendline and 65-week EMA. Since the long-term KST, which you can read about here, is also positive, there is little doubt that this ETF is in a primary uptrend. The bottom two windows, like all the remaining charts, display the relative line to the iShares MSCI World Stock ETF (ACWI) together with its long-term KST for relative action. In Israel's case, the situation is mixed but promising. That's because the RS KST has just gone positive, but the relative line itself is just below its 2015-2021 down trendline and 65-week EMA.
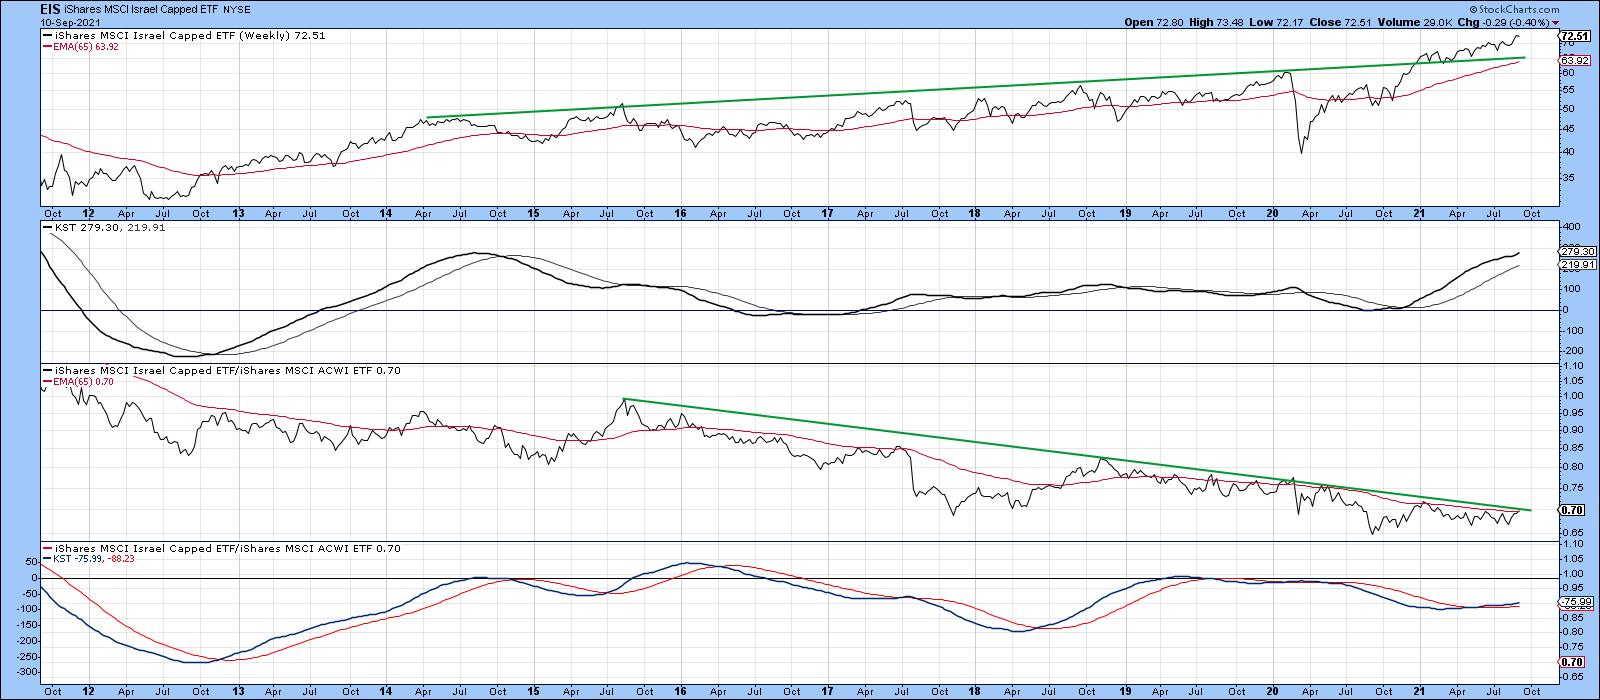 Chart 2Europe
Europe has been a relative laggard for some time, although some areas, notably Scandinavia and the Netherlands, have outperformed the world over the last few years. The UK, Norway and Italy may be set to follow suit.
Chart 3 shows that the UK ETF (EWU) has recently cleared a trendline, joining the 2014, 2018 and 2020 peaks. The price is comfortably above its 65-week EMA and the KST is positive. Its failure arises from the fact that the RS line has been unable to seriously clear its 65-week EMA since 2014. It's also significant that the EMA is currently trading at the same level as the dashed-green trendline. The effect is that they reinforce each other as an area of resistance, which, if bettered, would represent a very bullish signal, especially as the KST for relative action is already positive.
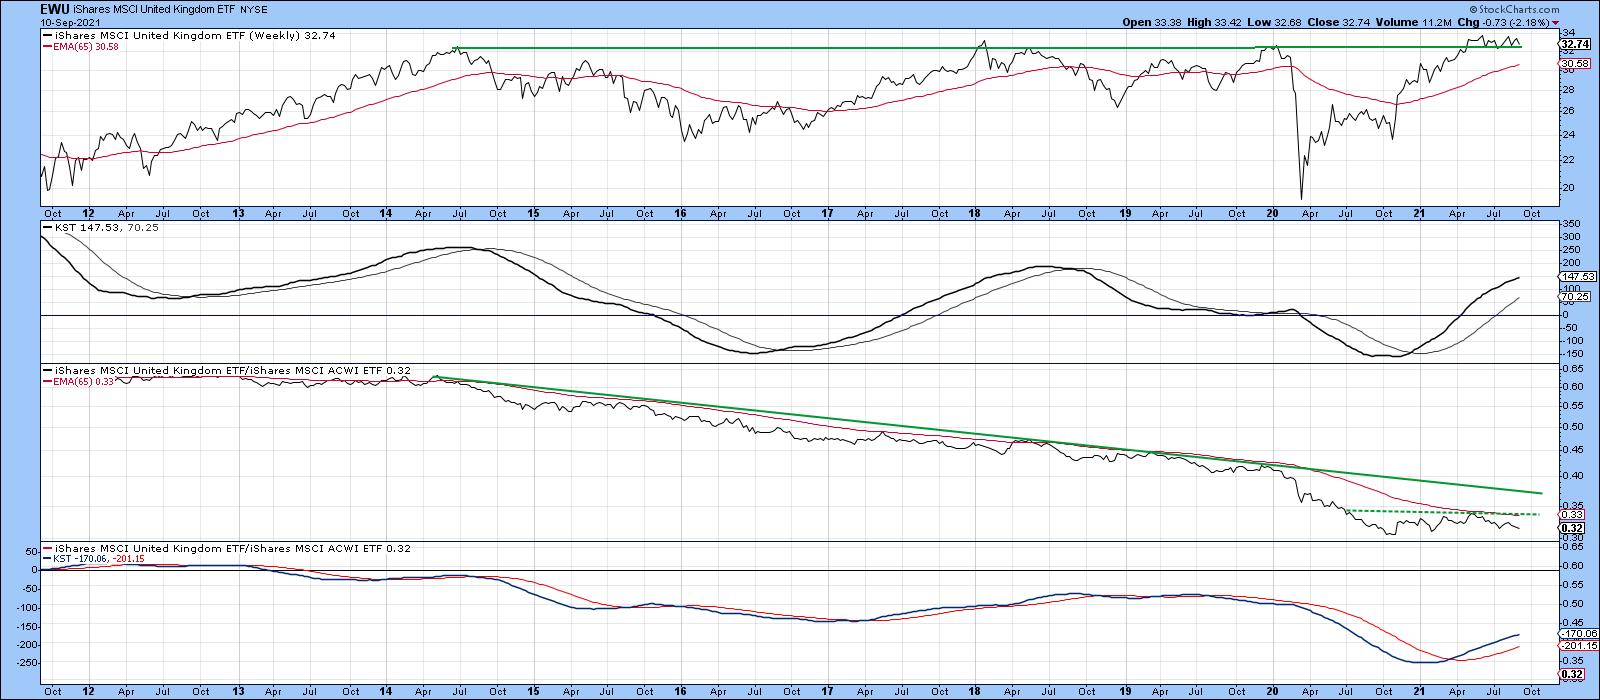 Chart 3The Norwegian ETF (NORW) is in a very similar position to that of the EWU, in that the price has already cleared long-term resistance. Unlike its other Scandinavian counterparts, NORW has not yet been able to establish a trend of improving relative action, though it is very close to its 2014-2021 down trendline. The rising KST for relative action is encouraging from that aspect.
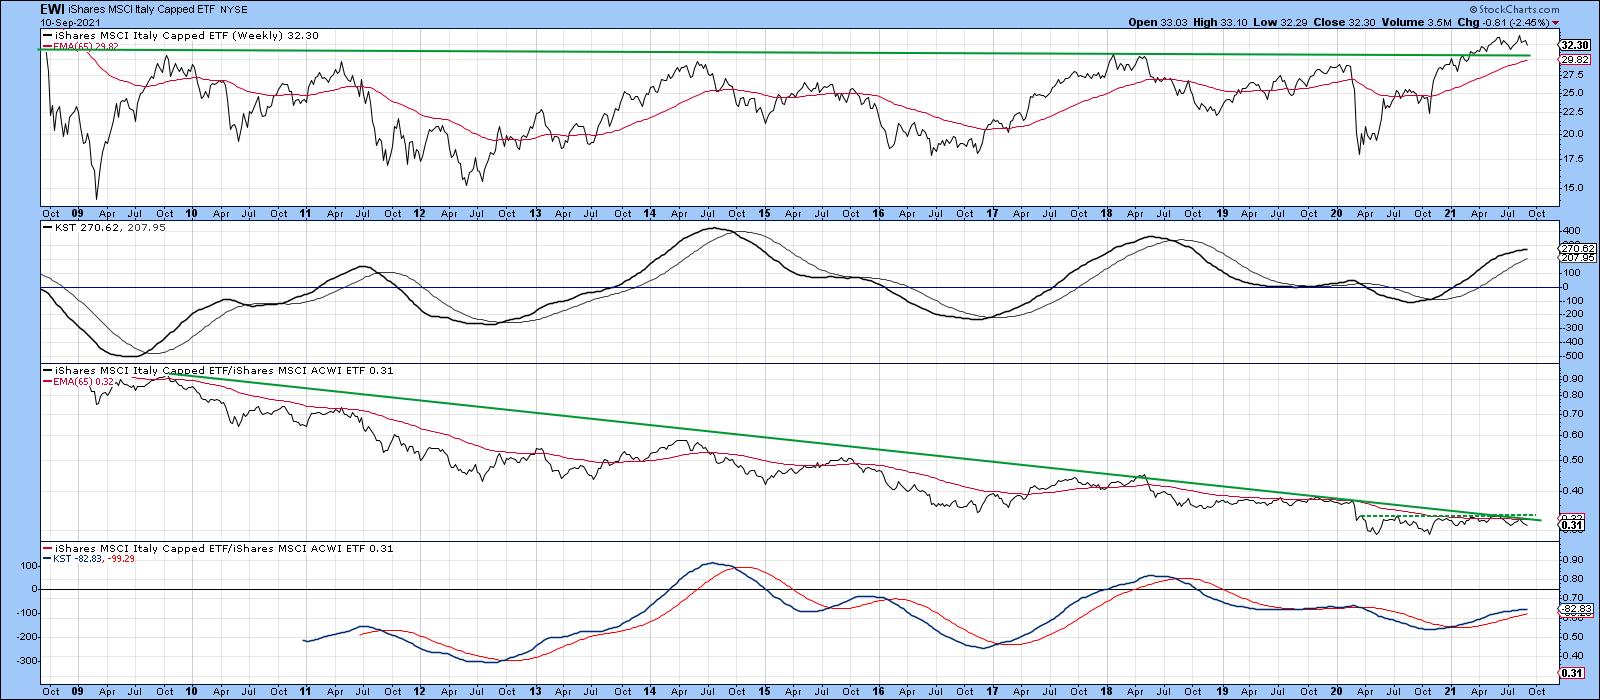 Chart 4The Italian ETF, the EWI, tried seven times to clear the 2009-2021 resistance trendline, shown in Chart 5. It finally did it earlier this year. The trend of relative action has gone flat since April of 2020, with the result being that the RS line is right at the convergence of two trendlines and its 65-week EMA. Since the KST for relative action is in a rising trend, it seems likely that this formidable resistance will be successfully overcome.
 Chart 5Latin America
In 2020, Mexico (EWW) broke below significant support in the form of the horizontal dashed red trendline in Chart 6. However, the break turned out to be a whipsaw. That meant that a powerful rally was likely to follow, as market participants scrambled to get back on the right side of the market. We have already seen an advance, which has resulted in a decisive break above the 2014-2021 down trendline. However, the size of that false downside break should enable the price to power still higher. Note that the RS line is close to its 65-week EMA and 2013-2021 down trendline. It has also gone extremely quiet, all of which suggests that, when it does break to the upside, a very powerful RS rally will follow. The positive RS KST argues for an eventual bullish relative break.
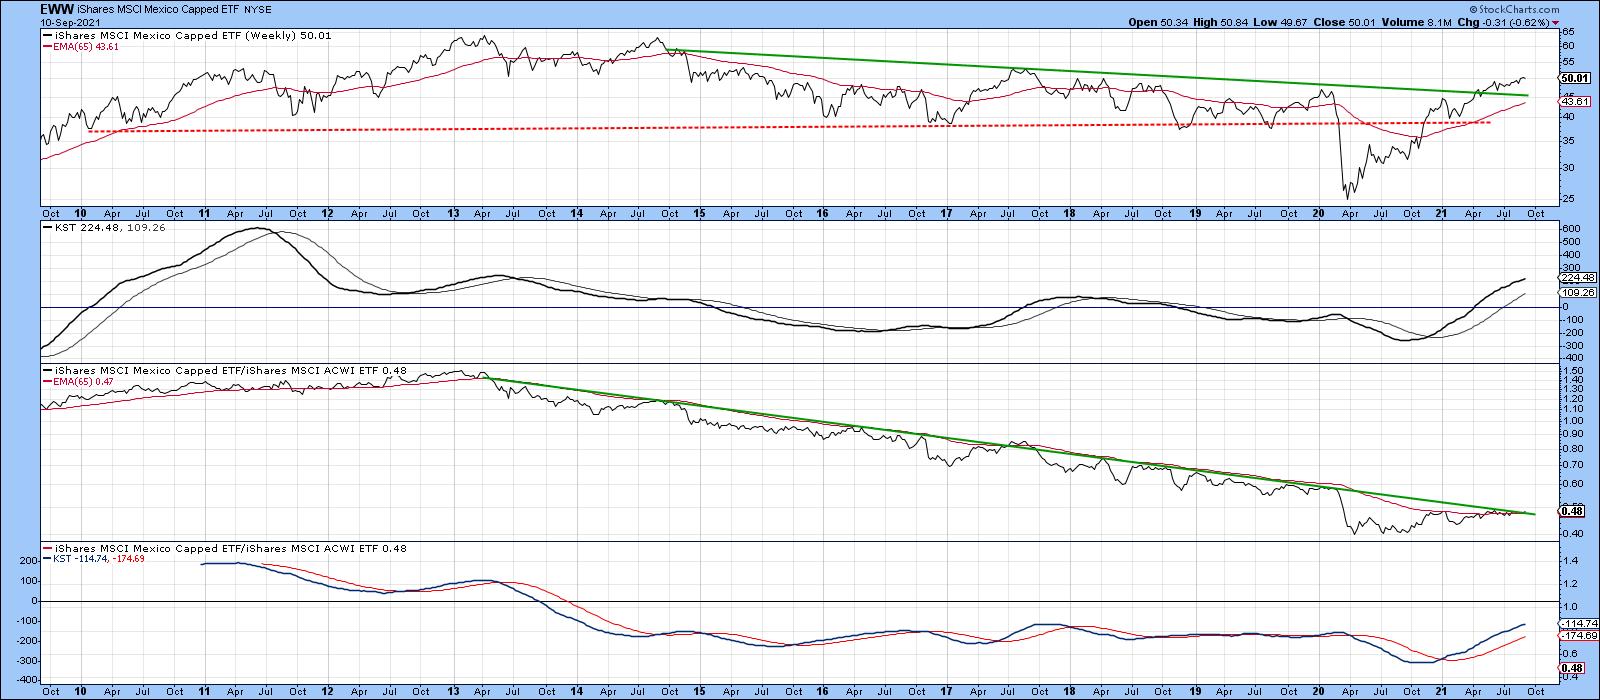 Chart 6
Further south, the Global X Argentina ETF has completed an inverse head-and-shoulders for both the absolute and relative prices. The two KSTs are also in the black.
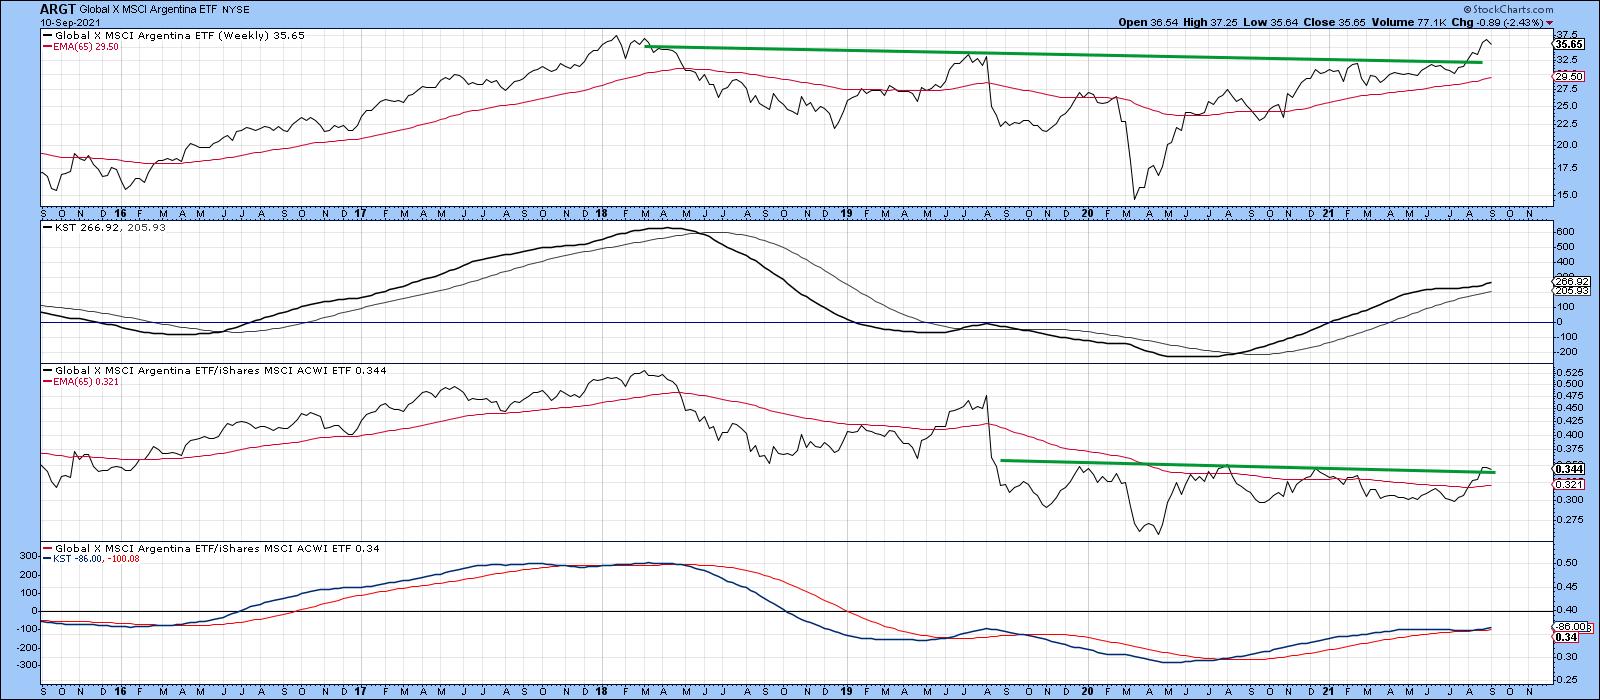 Chart 7
Frontier Markets
The iShares MSCI Frontier 100 ETF (FM) recently broke to a new all-time high. Just as impressive was the ability of the RS line to clear its 2018-2021 down trendline and complete a small base. A little more improvement in relative action will place the overall technical position in a solidly positive light.
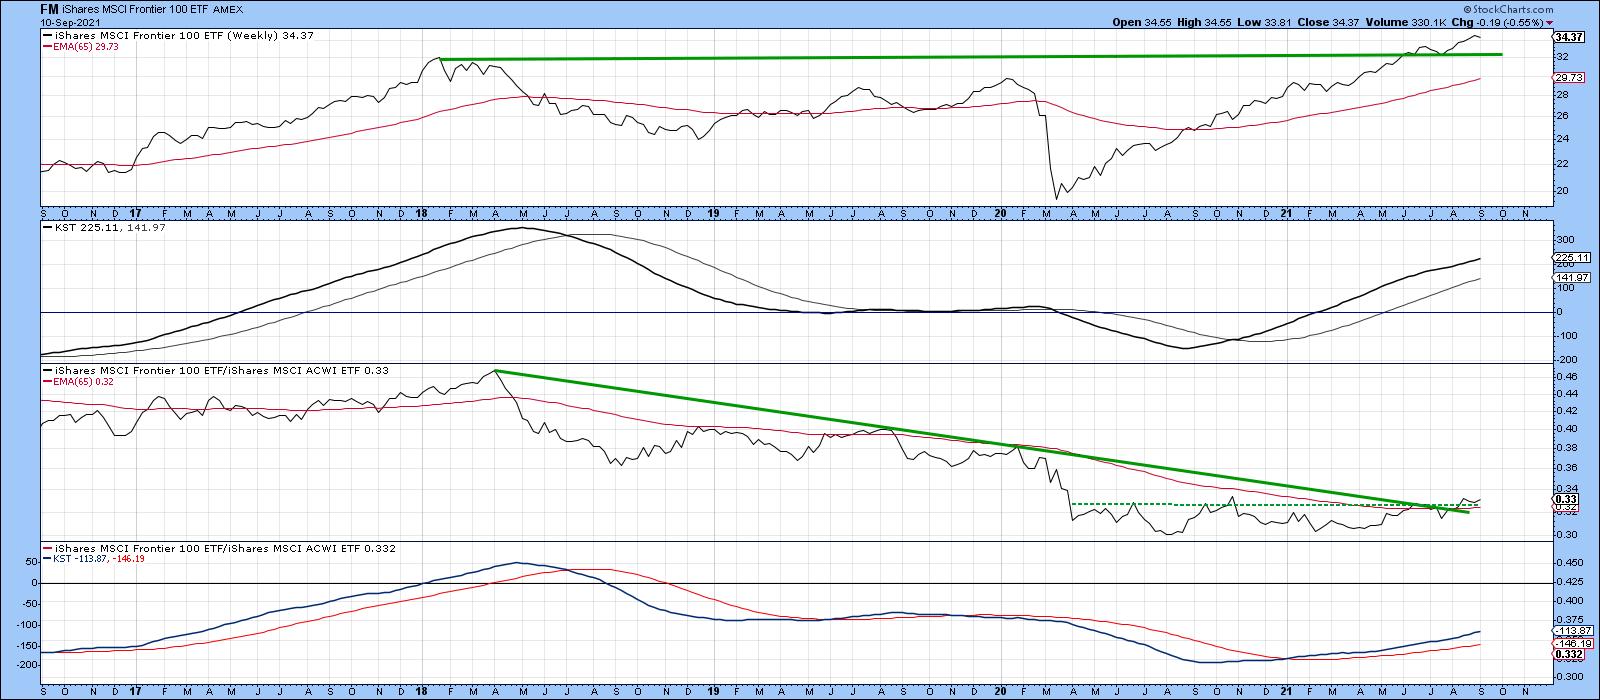 Chart 8The largest country holding for the Frontier Markets ETF is in Vietnam. The VanEck Vectors Vietnam ETF (VNM) is featured in Chart 9. Its technical picture is very similar to the European ETFs described earlier, whereby the price itself has broken above significant resistance and the RS line is poised to violate its long-term down trendline.
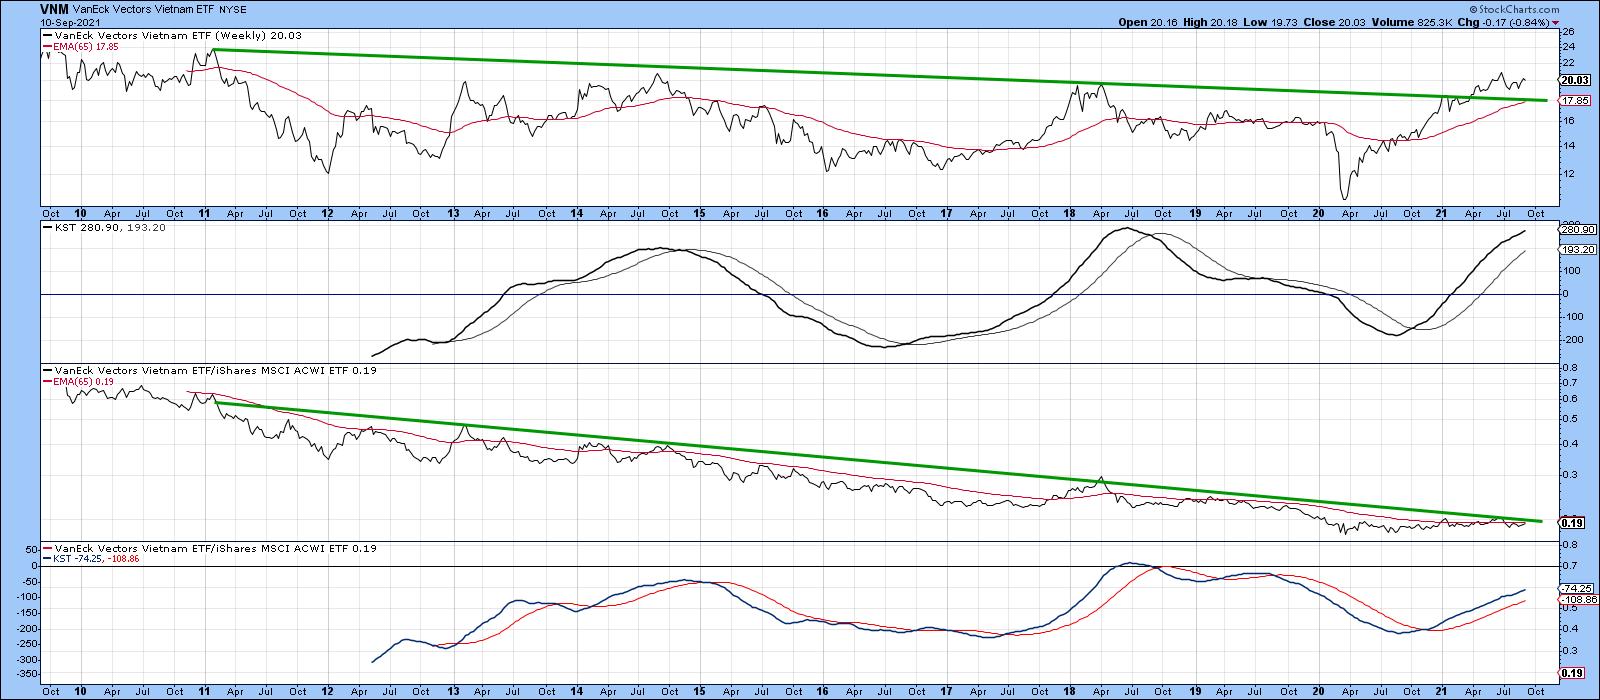 Chart 9Egypt has tentatively violated its 65-week EMA and 2014-2021 down trendline. It needs to be watched closely, since the long-term KST for the absolute price (and that of the relative one) are not yet in a uniform ally bullish trend. The overall technical action, though, does qualify as a potential sleeper.
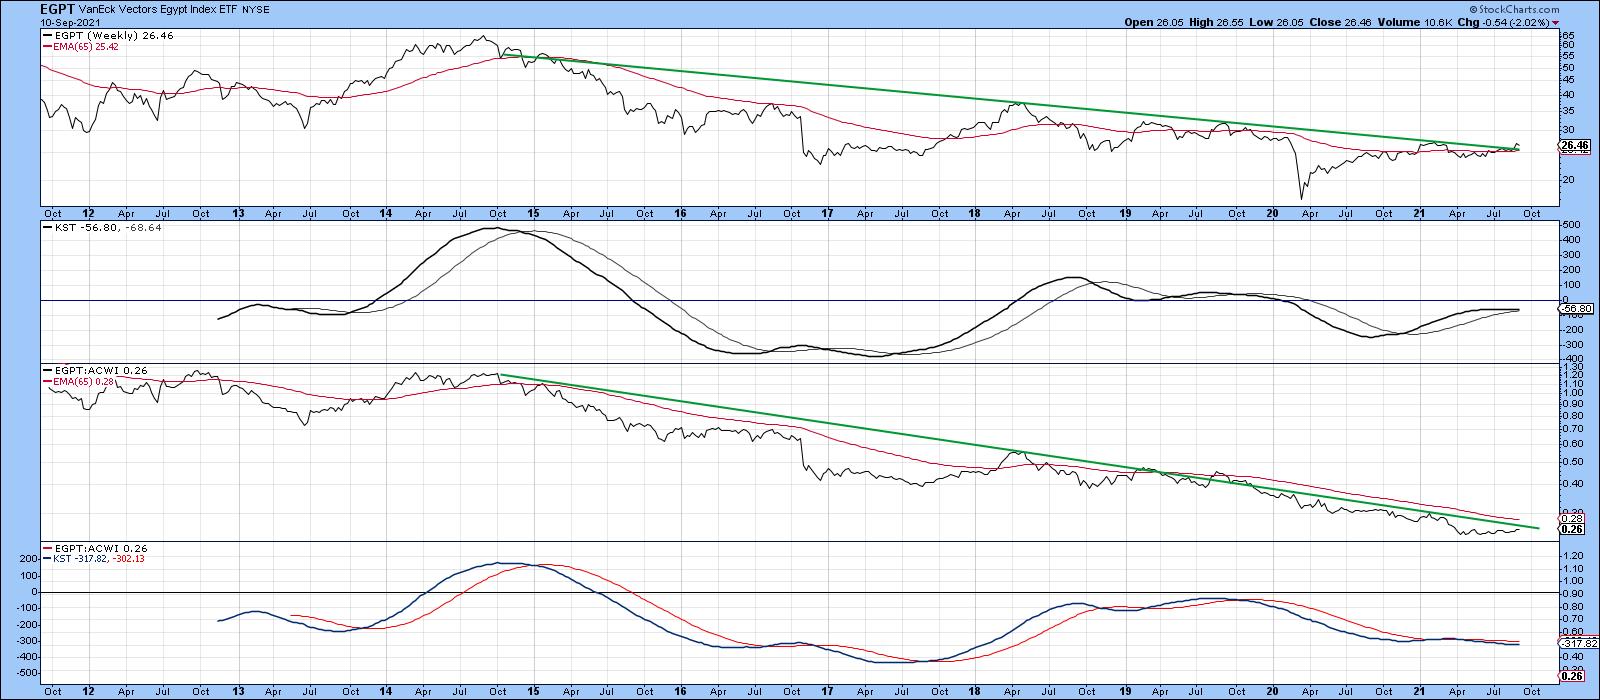 Chart 10Good luck and good charting,
Martin J. Pring
This article is an updated version of an article previously published on Tuesday, September 7th at 6:55pm ET in the member-exclusive blog Martin Pring's Market Roundup.
The views expressed in this article are those of the author and do not necessarily reflect the position or opinion of Pring Turner Capital Group of Walnut Creek or its affiliates.


