Technology outperformed throughout the second decade of this century, but the times they are a-changin', as it is obvious that this sector has lost enough mojo in the last year to indicate that a basic transformation in market leadership is underway. Just to be clear, I am not saying that this new emerging leadership will last as long as tech leadership has, nor will it be as dominant. What I am suggesting is that tech is unlikely to regain its relative leadership for many years to come and that energy, staples and financials are likely to be some of the initial relative beneficiaries.
Major Top for NASDAQ Relative Action
In that respect, Chart 1 shows the relative strength of the tech-dominated NASDAQ against the S&P Composite from 2000. It peaked at the beginning of 2021 and has since been tracing out a series of declining peaks and troughs, which has also involved the completion of a major top and the downside penetration of its 24-month MA. That action follows a run-up from the 2002 bottom in the relationship, which suggests that the recent downside reversal will be of historic proportions. One note of caution lies in the fact that the monthly charts featured in this article are plotted with early January data. The real January plot will not be known until the month-end closing.
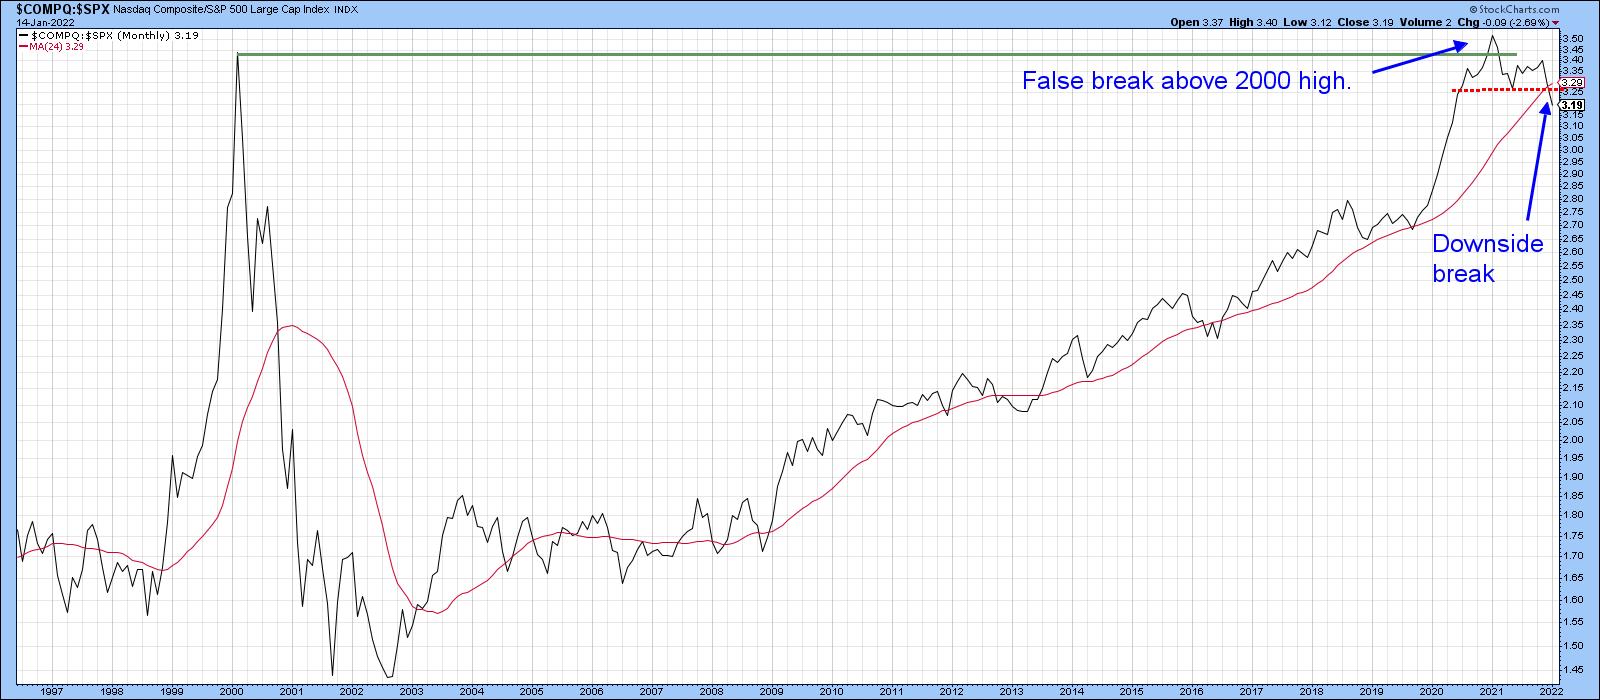 Chart 1
Energy, Staples and Financials are Taking Over
There is precedent for some of this, as financials, staples and, to a lesser extent, energy all outperformed following the bursting of the tech bubble in 2000. This is shown in Chart 2, where their relative action, based on Dow Jones data, has been plotted. Now let's take a closer look at the current situation.
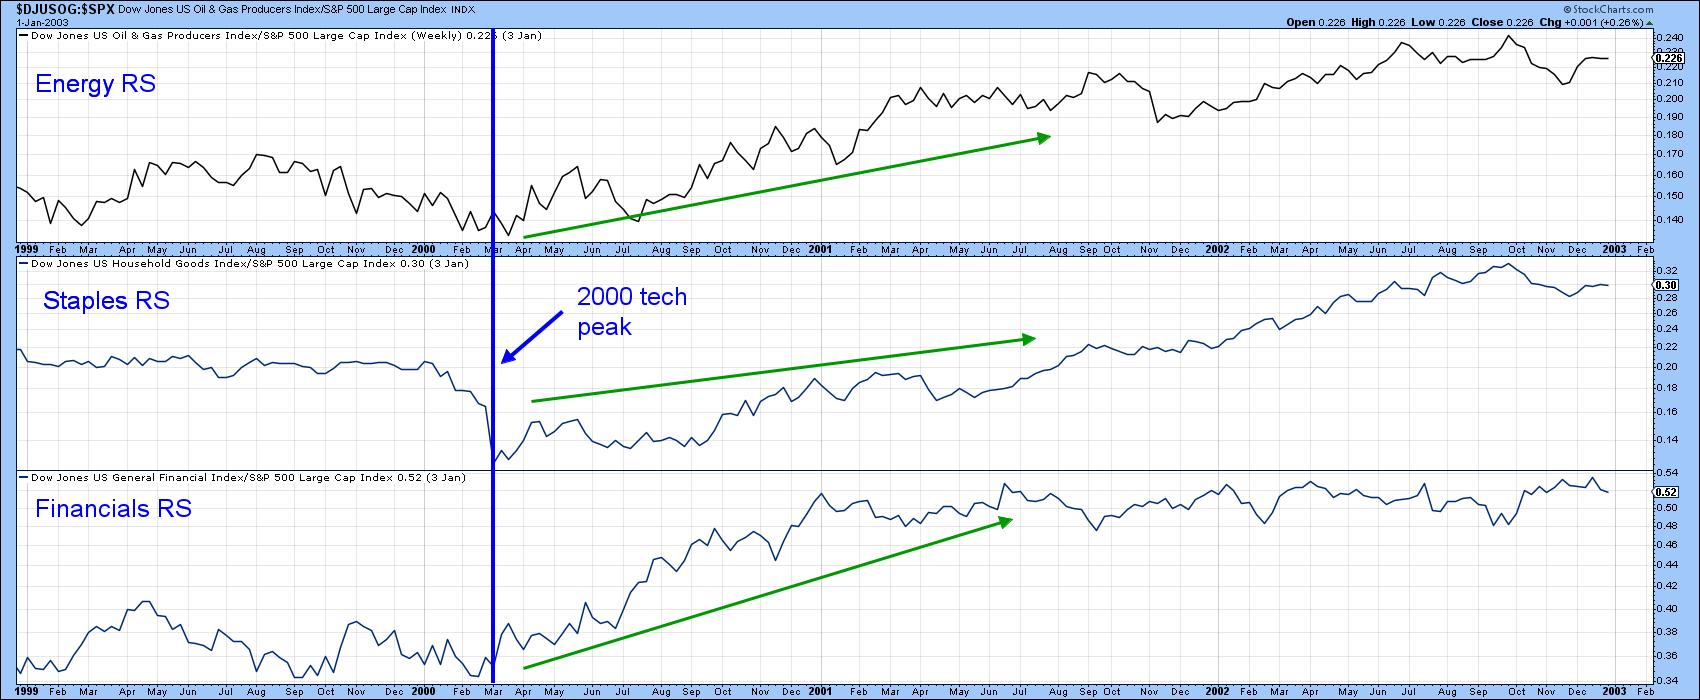 Chart 2
In that respect, Chart 3 shows that the SPDR Energy (XLE) and Consumer Staples (XLP) ETFs have already experienced a relative breakout both above resistance trendlines and their 65-week EMAs. For its part, the financial index is above its EMA. However, it has not yet been able to clear the neckline of a potential inverse head-and-shoulders.
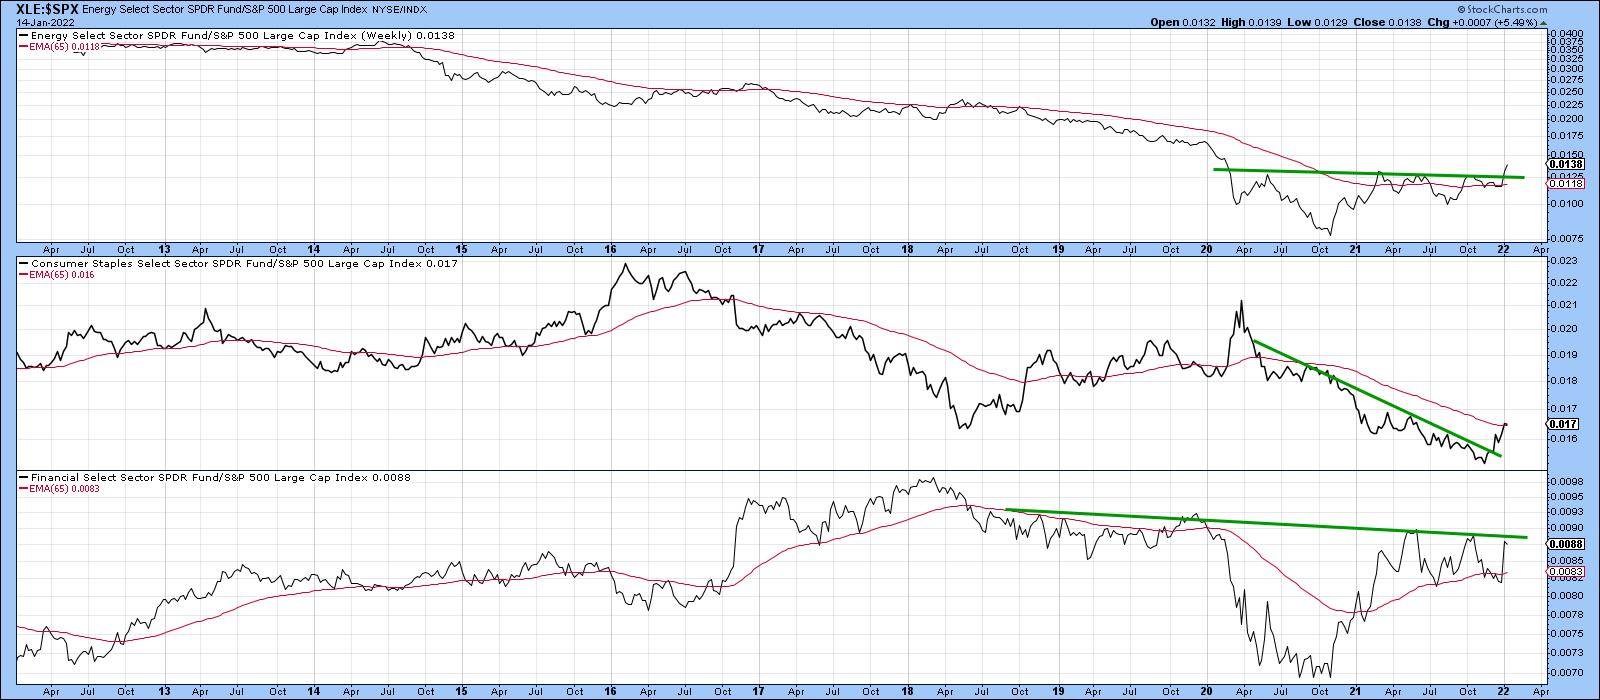 Chart 3
Chart 4 again features financial relative action, this time in conjunction with three momentum indicators. Since the short- and long-term KSTs are in a bullish mode, an upside break in the ratio seems likely.
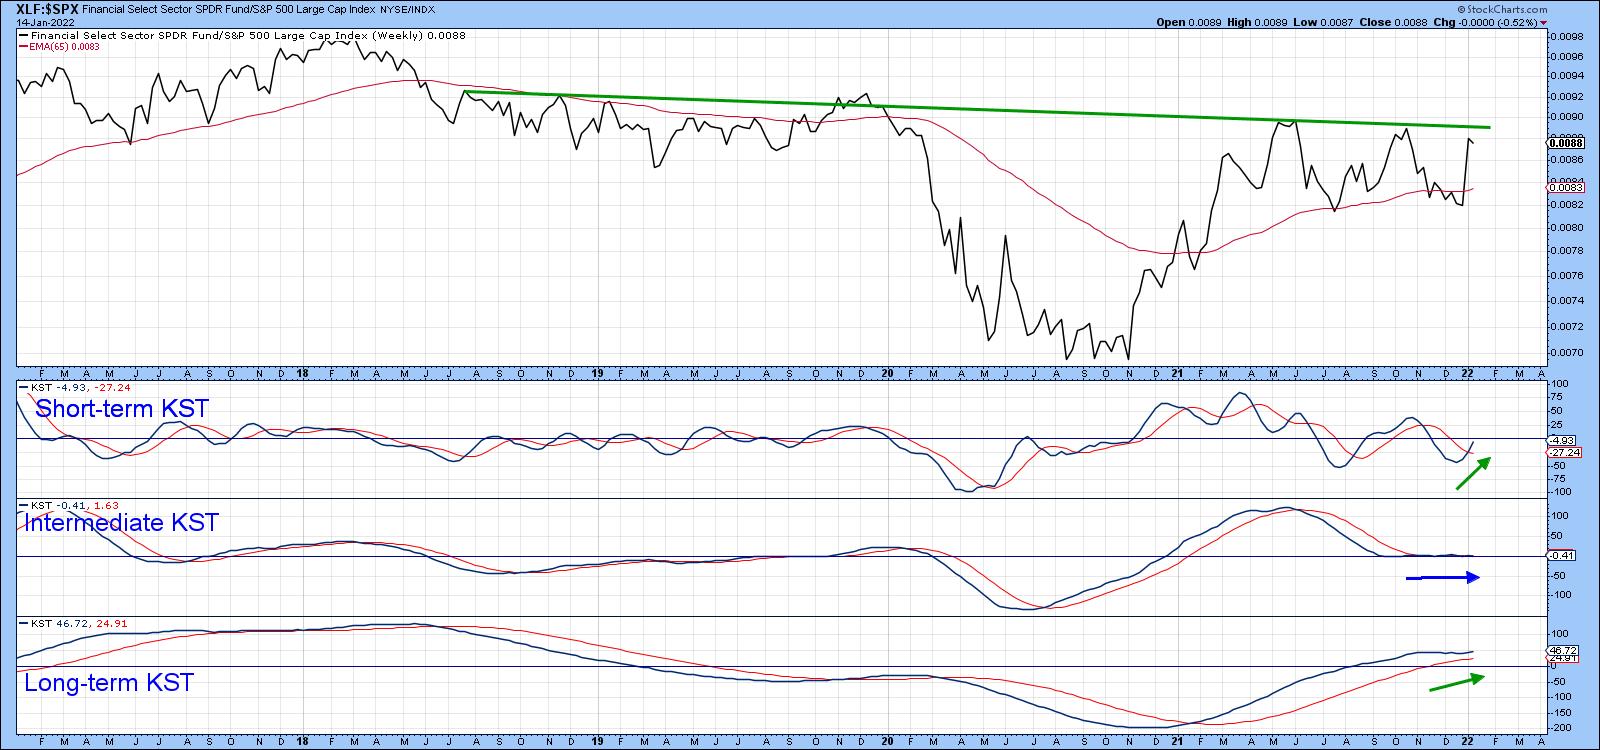 Chart 4
Three Weaker Sectors
Superior relative action by some sectors implies a weaker performance by others. Chart 5 displays three possible candidates: communications services, technology (of course) and a range-bound healthcare. Even though all three are below their 65-week EMAs, I hedge my bets by applying the word "potentially" to healthcare, since it has yet to drop below that 2014-2022 support trendline. It's a very long line and has been touched or approached on numerous occasions, which makes it a very significant one. If it gives way, that would be a very serious long-term negative development for the sector.
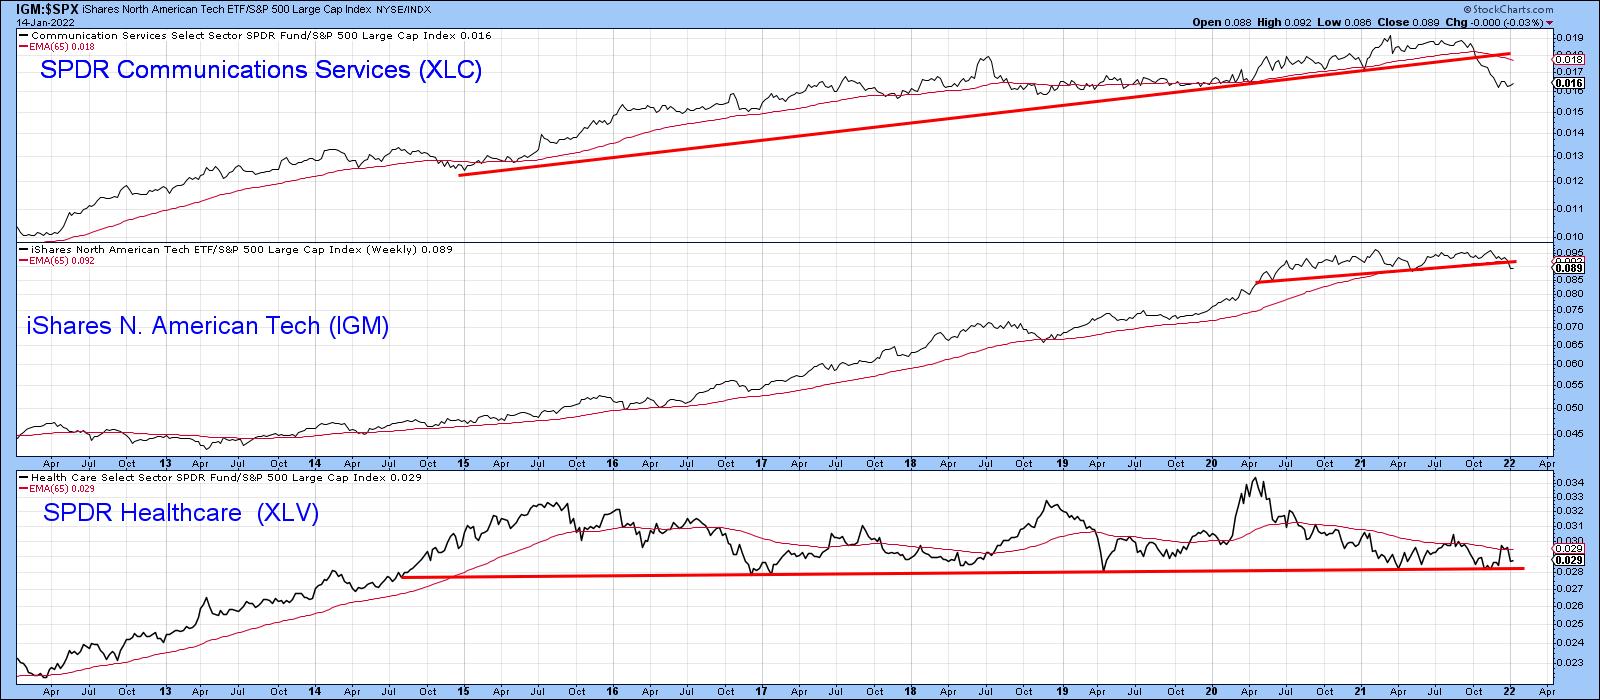 Chart 5
Cross-Sector Relationships Also Provide Clues
We usually think of relative action being determined by a specific sector relative to the market (S&P Composite) but plotting the data using cross-sector relationships often provides valuable supporting evidence. For example, Charts 6, 7 and 8 compare the iShares Consumer Staples (IYK) ETF, the iShares US Energy (IYE) and the iShares Financial ETF (IYF) to the IYH iShares Health Care (IYH).
Chart 6 shows that the Consumer Goods or Staples ETF has broken above a 7-year resistance trendline favoring staples. Since the short- and intermediate-term KSTs are in a bullish mode and the long-term series has started to turn up, a more decisive breakout seems likely.
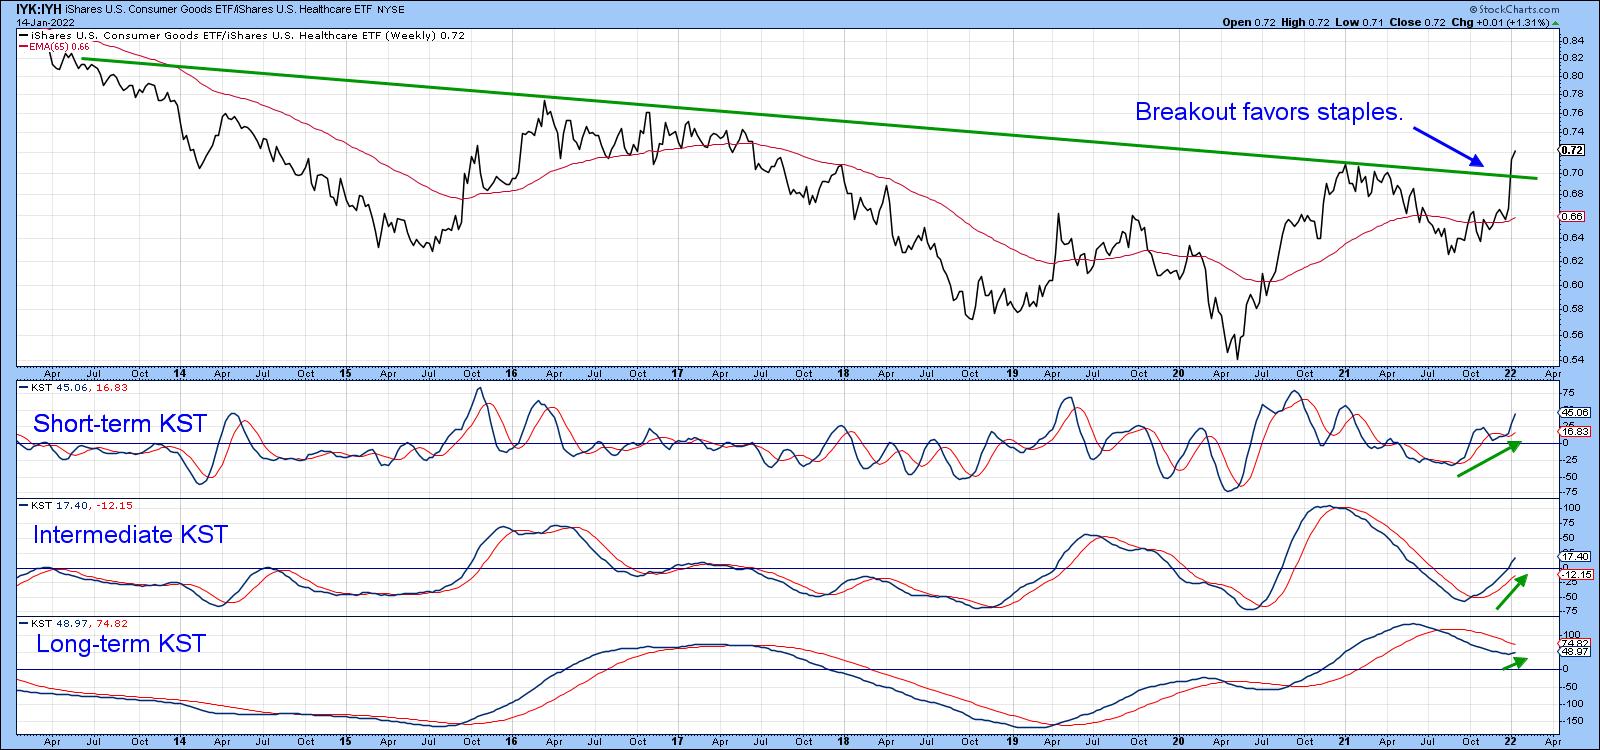 Chart 6
Energy also appears to be breaking against the iShares Healthcare, as the ratio is above its 65-week EMA and marginally above the 2014-2022 down trendline and the 2020-2022 resistance trendline. Since all three momentum indicators are rising, a more decisive and believable breakout seems a likely proposition in the period directly ahead.
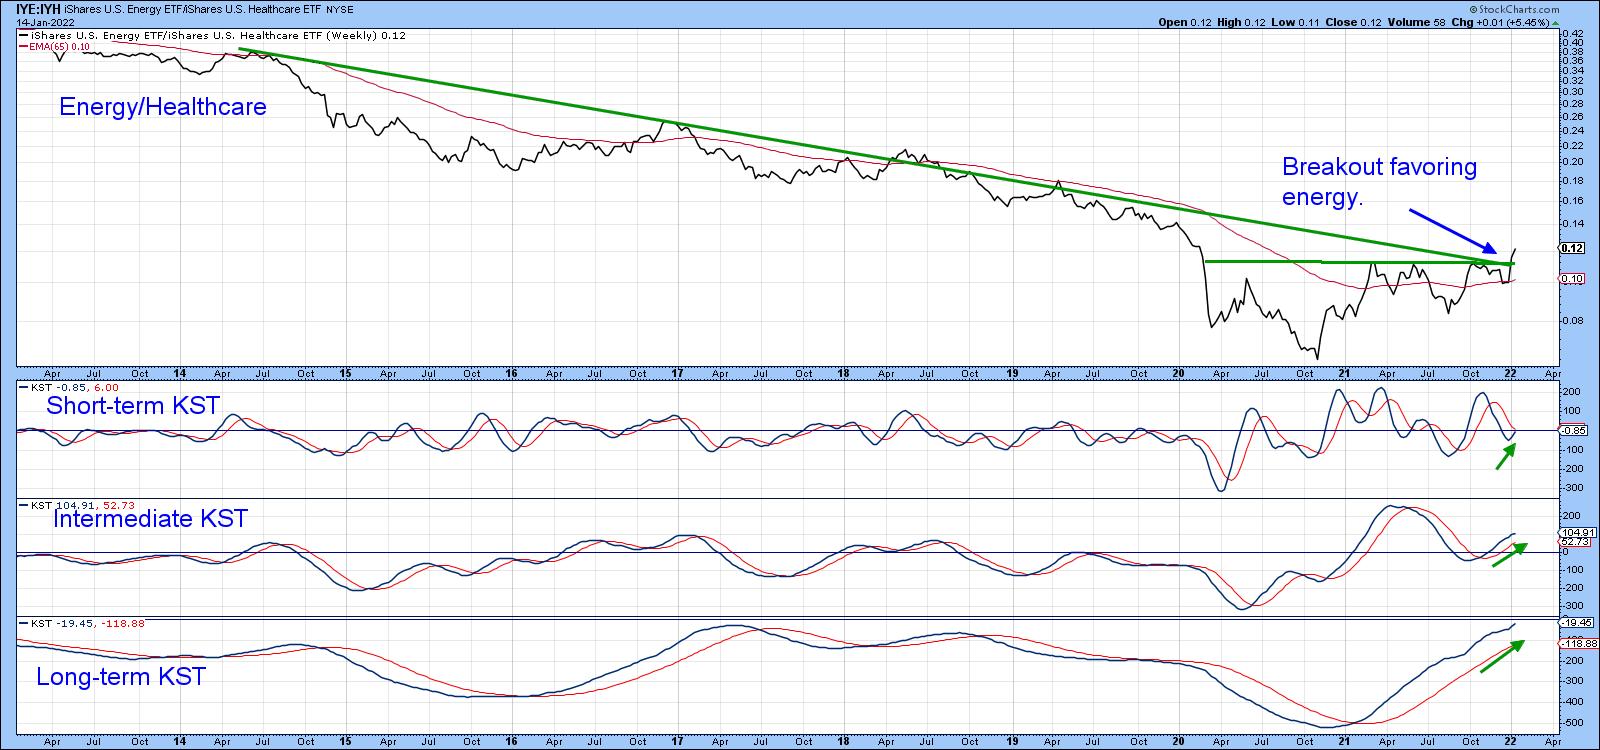 Chart 7
Finally, Chart 8 tells us that the ratio between the iShares Financial ETF (IYF) and the iShares Healthcare (IYH) has tentatively cleared a 13-year resistance trendline. All three KSTs are in a rising mode, so, once again, the probabilities favor that a more decisive breakout will transpire as the month progresses.
 Chart 8
NASDAQ vs. Energy
I wrote about the NASDAQ/Energy relationship a couple of times last year regarding a possible long-term reversal favoring energy. The latest 2022 data now confirm that the 13-year period of technology dominance, epitomized by the NASDAQ, has finally culminated with the completion of a 2-year head-and-shoulders top. Note also that the ratio has traced out a series of declining peaks and troughs and is decisively under its 12-month MA. Finally, the PPO has dropped below zero, thereby indicating that its 6-month EMA is trading below its 15-month counterpart.
The pink shading indicates that this condition has not been kind to the NASDAQ, to say the least. That suggests this index is likely to underperform energy for many years to come. The rationale is not difficult to see, as both tech and energy face government regulation. The difference is that tech margins are likely to be trimmed as a result of regulation, whereas energy producers will benefit from the higher prices induced by government-inspired restrictions and shortages.
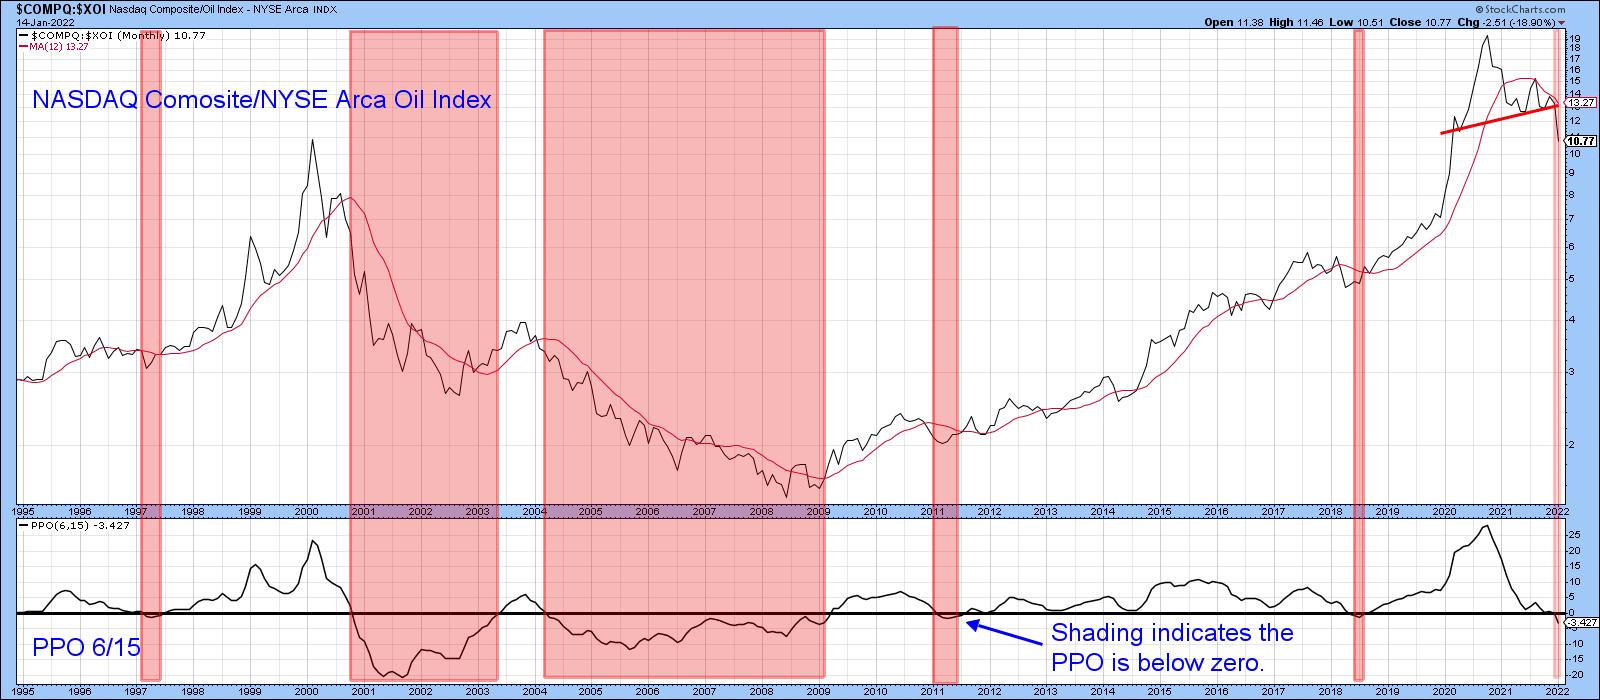 Chart 9
This article is an updated version of an article previously published on Monday, February 7 at 6:27pm ET in the member-exclusive blog Martin Pring's Market Roundup.
Good luck and good charting,
Martin J. Pring
The views expressed in this article are those of the author and do not necessarily reflect the position or opinion of Pring Turner Capital Group of Walnut Creek or its affiliates.


