 Buyers and sellers are slugging it out for control of the long-term trend for the S&P 500. This battle is raging near the 200-day SMA, which is perhaps the most widely followed long-term moving average. The S&P 500 is also the most widely followed benchmark for US stocks.
This is a powerful combination and market participants should take notice. Good things are more likely to happen when above the 200-day SMA (uptrends) and bad things are more likely to happen when below the 200-day (downtrends). It is all about odds and the odds are shifting further in favor of the bears.
Instead of using the closing price and the 200-day (red line), I prefer to smooth closing prices with a 5-day SMA (green line). This reduces whipsaws and keeps the signal timely. The 5-day dipped below the 200-day in late January, popped back above in February and moved back below this week. Whipsaws are unavoidable. The current signal is the most important and this signal is bearish until proven otherwise.
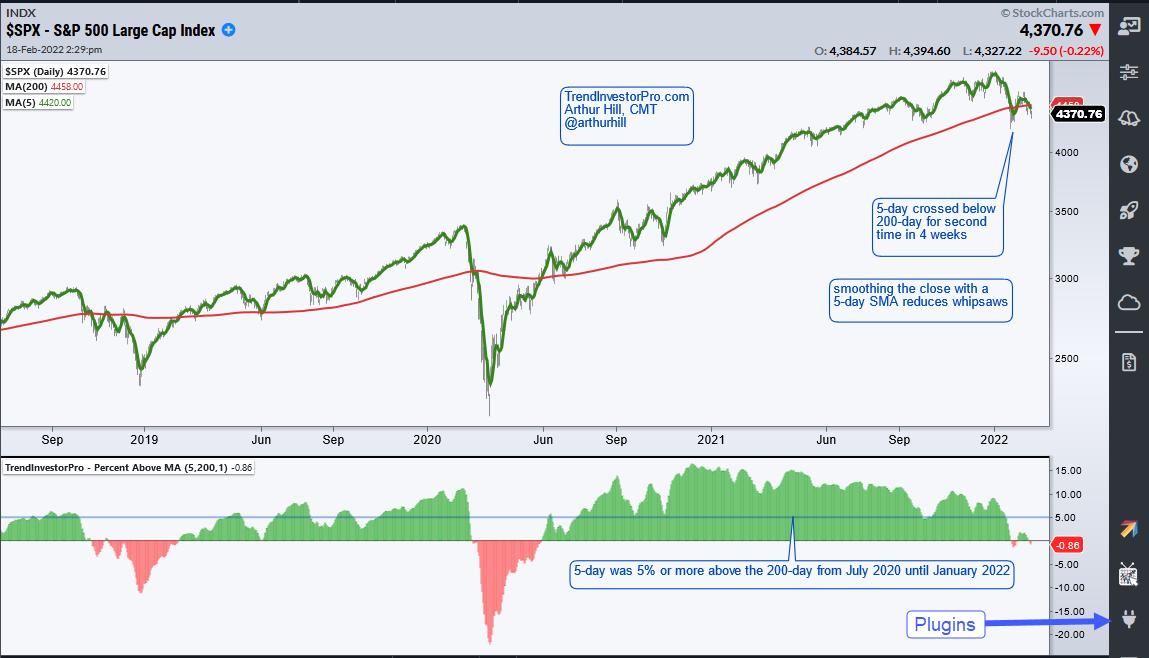
The indicator window shows an oscillator that measures the percentage difference between the 5-day SMA and the 200-day SMA. It is green when the 5-day is above the 200-day and red when the 5-day is below. This makes it easy to see crosses and the percentage distance between the two SMAs. The 5-day SMA was 5% or more above the 200-day from July 2020 until January 2022. These two dips below zero in the last four weeks show that weakness is spreading to large caps.
The Composite Breadth Model at TrendInvestorPro triggered this week as well and risk is rising within the stock market. Moreover, correlations tend to rise when the S&P 500 turns down and this means there could be few places to hide. Commodities and commodity-related ETFs are still at the top of our ranking table right now. Click here to learn more
The Percent Above MA is one of 11 indicators in the TrendInvestorPro Indicator Edge Plugin for StockCharts ACP. Other indicators include the Trend Composite, Momentum Composite and ATR Trailing Stop. Click here to learn more
-------------------------------------------------
Choose a Strategy, Develop a Plan and Follow a Process
Arthur Hill, CMT
Chief Technical Strategist, TrendInvestorPro.com
Author, Define the Trend and Trade the Trend
Want to stay up to date with Arthur's latest market insights?
– Follow @ArthurHill on Twitter


