Before we look at the two-bar reversal, let's first review the long-term technical position for the Dollar Index. It's laid out on a quarterly basis in Chart 1, along with a Coppock momentum indicator. The first thing to note is that the Index is positioned below its secular down trendline, dating from the 1980s. That's not a real plot yet, since the end-of-quarter data required for a quarterly close is not yet available. However, it certainly does indicate that the Index is facing significant overhead resistance.
The Coppock Curve has been completely flat since 2019. That's an awfully long time, reflecting a really tight balance between buyers and sellers. Note that the red up trendline completely covers the 40-quarter MA, telling us that, on a quarterly close basis, the 91.90 level is one of tremendous long-term support. Since the Index is above the trendline and MA, that rates the primary trend as bullish, though I would be much more confident in this view in the event that the Index manages to rally above its secular down trendline.
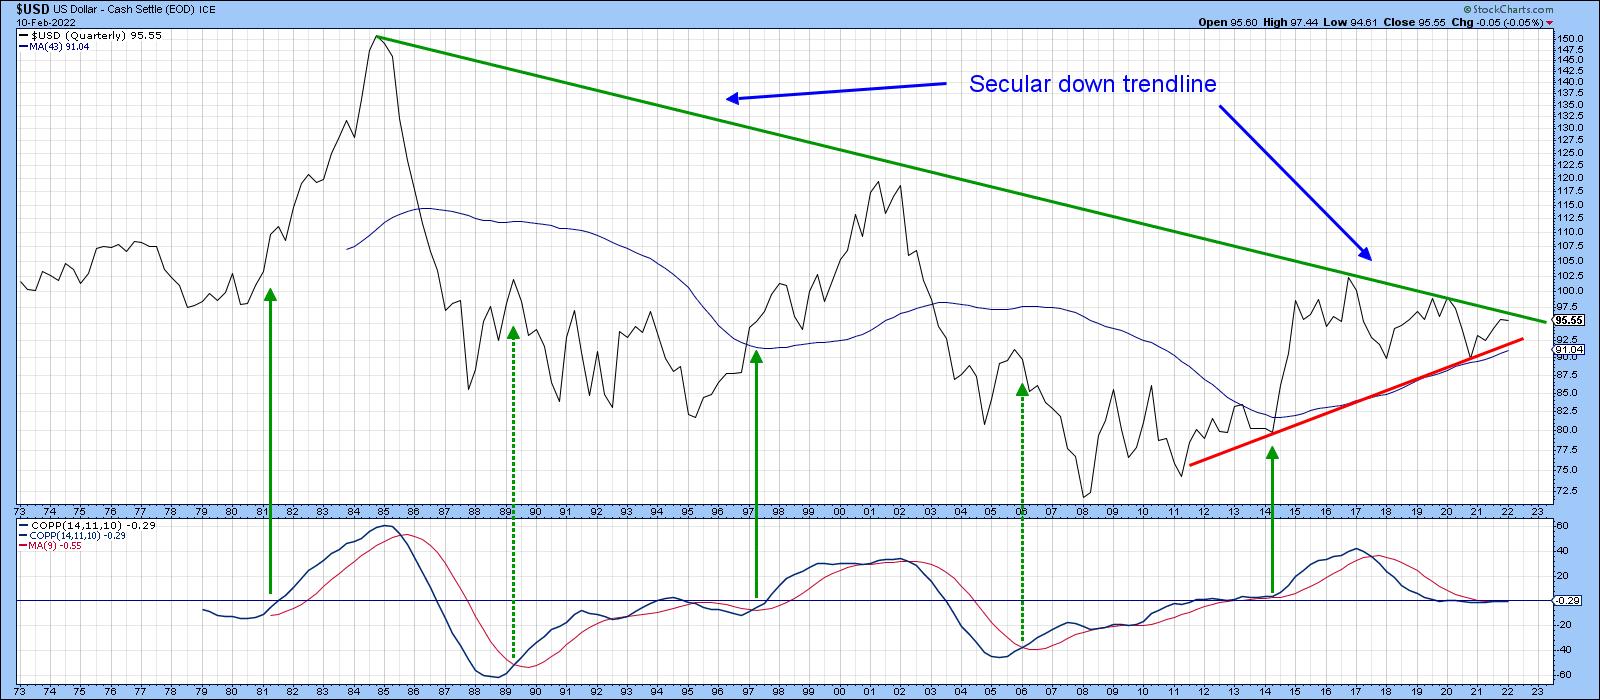 Chart 1
Chart 2 displays monthly data. Since 2015, price action has experienced a giant trading range environment. Each swing in the direction of either of the two converging trendlines has represented a mini-bull or bear market in its own right. Those lines are currently residing in the 90 and 97 areas, which are the two end-of-month benchmarks to beat. Right now, the KST is bullish and the Index is trading above its 12-month MA. In my book, that classifies the primary trend as bullish. In reality, though, the erratic nature of MA crossovers during the trading range means that the real benchmarks remain at the two trendlines. More importantly, from an upside breakout aspect, is the early 2020 high at just under 100. Why there? Because a move above 100 would re-confirm the series of rising peaks and troughs that has been taking place since 2011.
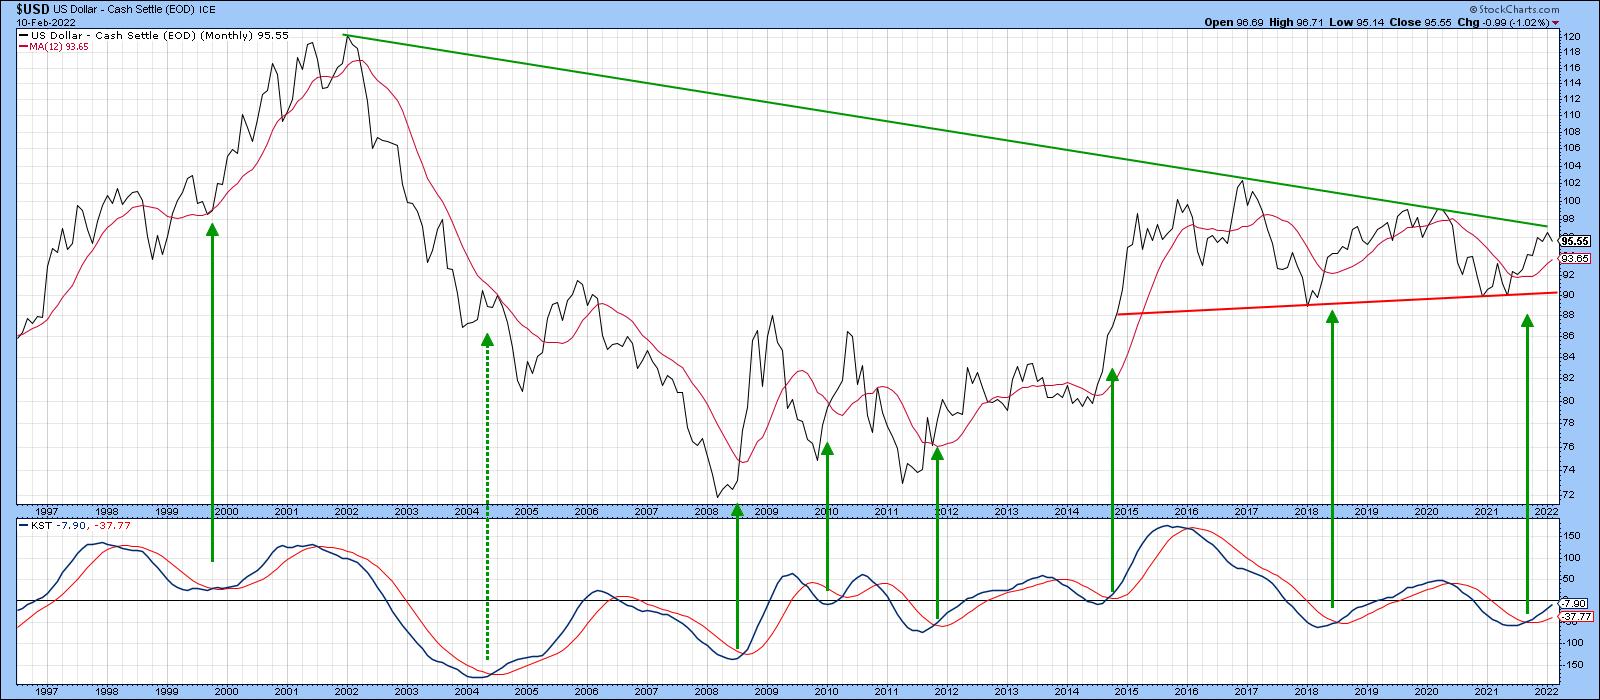 Chart 2
Chart 3 shows some more resistance in the form of the 2015-2022 down trendline for the Special K indicator, which you can read about here. That's important because the Index itself was recently at daily close resistance and appears to have failed the test, which is where our bearish two-bar reversal comes in.
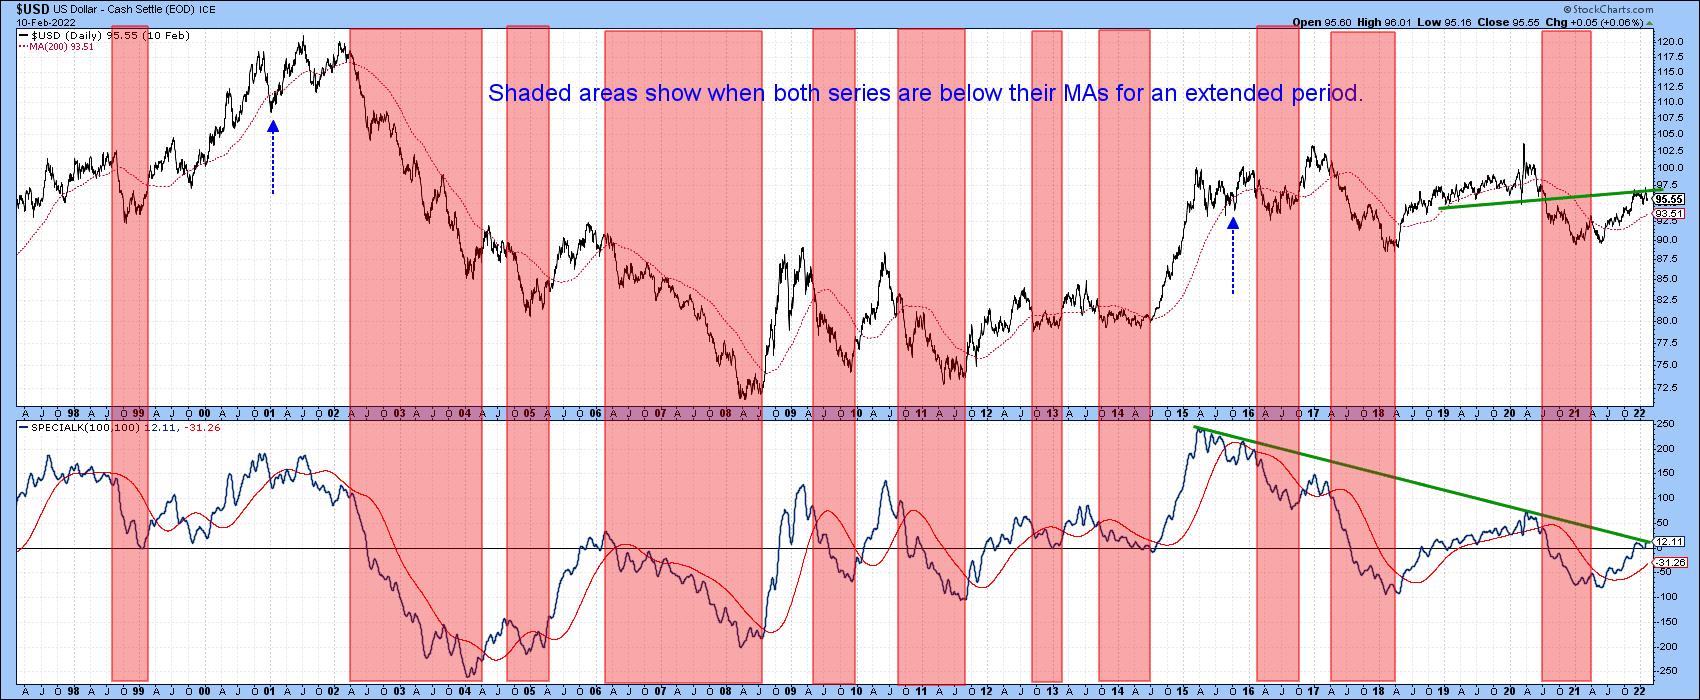 Chart 3
The Two Bar Reversal
Chart 4 shows that the Dollar Index completed the second bar of a bearish weekly two-bar reversal last week. Typically, a bearish two-bar reversal develops after a rally, where the first bar opens near its low and ends near its high. This shows that the buyers are in complete control at the end of the period. The second bar opens around the level of the previous close, but ends the session right back in the area of first bar's open. This action reflects the fact that a market previously dominated by buyers has reverted to one in which sellers are now in control.
To gain significance:
1. First, these two bars should first be wider than those leading up to the pattern, as is the case with January price action. The wider the bars, the bigger the battle between buyers and sellers and the stronger the indicated reversal.
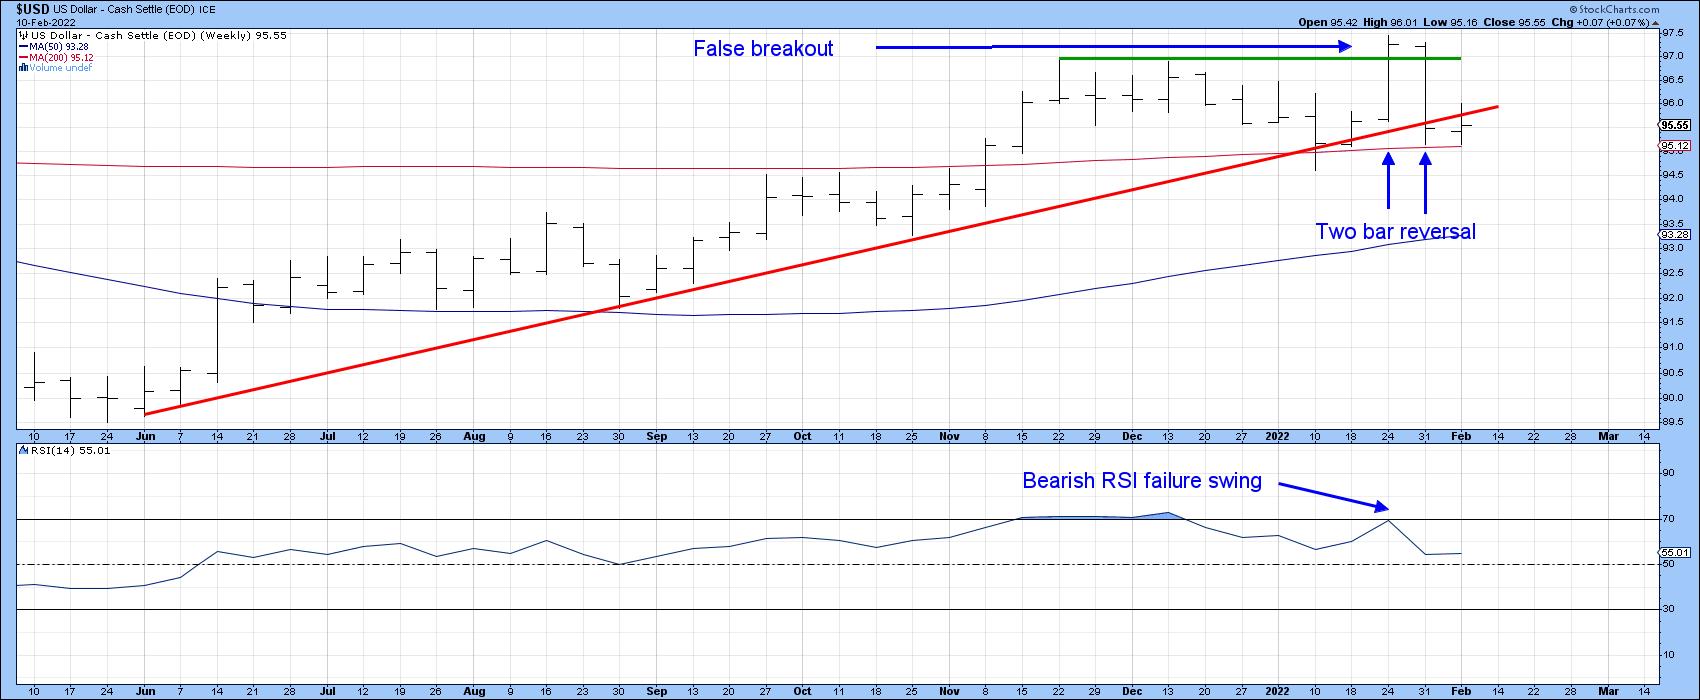 Chart 4
2. Second, expanded activity underscores a more significant buyer/seller conflict and enhances the significance of a specific pattern. There are no volume figures for the Index, but Chart 5 for the Invesco DB US Dollar Index (UUP) reveals a huge expansion of activity on the bearish second bar.
3. Third, the longer the period reflected in the bar, the longer its effect is likely to be. Thus, a two-bar reversal on a 10-minute chart has nowhere near the significance as one that appears on a monthly bar and so forth. These are weekly bars and are expected to have a negative effect for between 5-10 weeks. That could take the form of a decline or, less likely, a sideways consolidation below the top of the two bars.
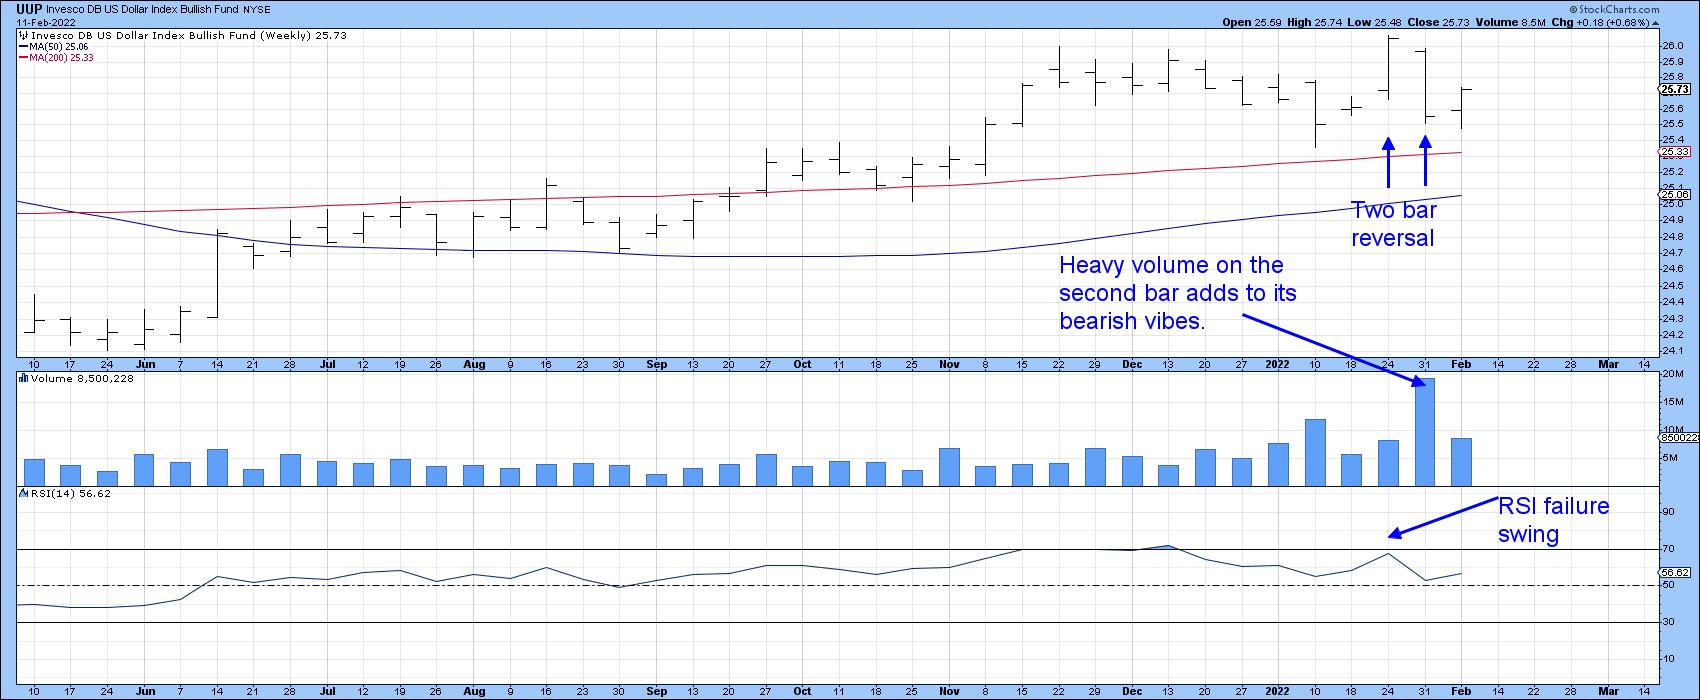 Chart 5
4. Finally, since two-bar reversals should have something to reverse, they should consequently be preceded by some form of advance. In our example, the two bars were preceded by a rally and a 9-week trading range -- not exactly a textbook case. However, this formation, as Chart 5 shows, represented a false breakout above that trading range. That's pretty serious, since such whipsaws are typically followed by above-average price moves in the opposite direction to the break. One caveat is that the two-bar reversal is only one piece of trend reversal evidence. I like to see some form of additional proof as confirmation. In this instance, we would need to see a decisive negative break that can hold below the red up trendline and 200-week MA.
Chart 6 also shows the false break, but this time using daily close data. It, too, offers a good confirmation benchmark, with a daily close under the 2022 up trendline, say, at 95.
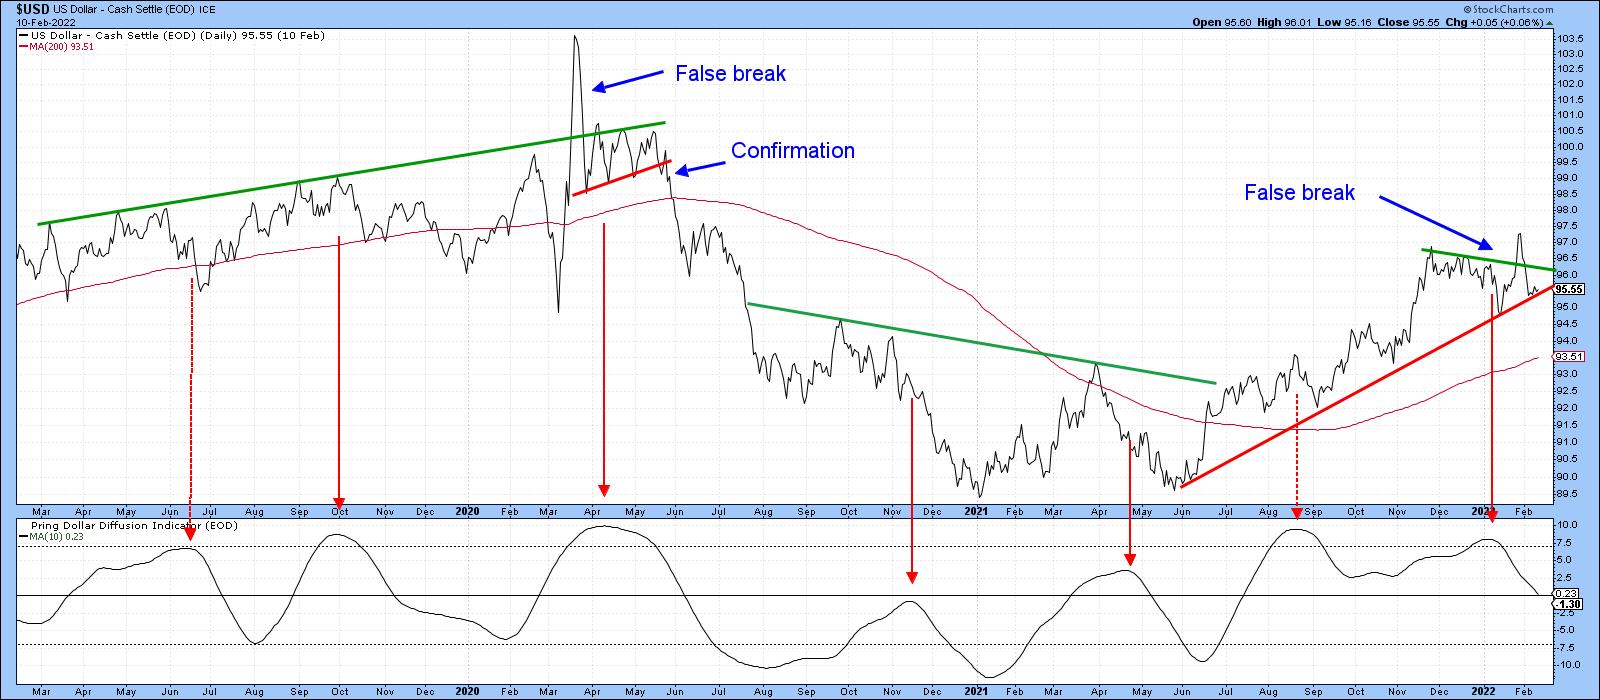 Chart 6
Conclusion
The Dollar Index is in a primary uptrend and nothing has yet taken place to subvert that view. However, the bearish two-bar reversal, if confirmed, suggests that the bull market case is likely to be tested in the coming weeks. If that happens, I would expect to see the price of gold, which has been pretty quiet recently, experience a memorable rally.
This article is an updated version of an article previously published on Monday, February 7 at 6:27pm ET in the member-exclusive blog Martin Pring's Market Roundup.
Good luck and good charting,
Martin J. Pring
The views expressed in this article are those of the author and do not necessarily reflect the position or opinion of Pring Turner Capital Group of Walnut Creek or its affiliates.


