 The S&P 500 SPDR (SPY) surged 5.77% from Tuesday to Thursday and this was the biggest 3-day surge since the 6.07% advance on November 5th, 2020. This early November surge led to a breakout and the advance extended until January 2022. The current surge also shows some serious short-term strength, but there are some key differences between now and November 2020. Let's investigate.
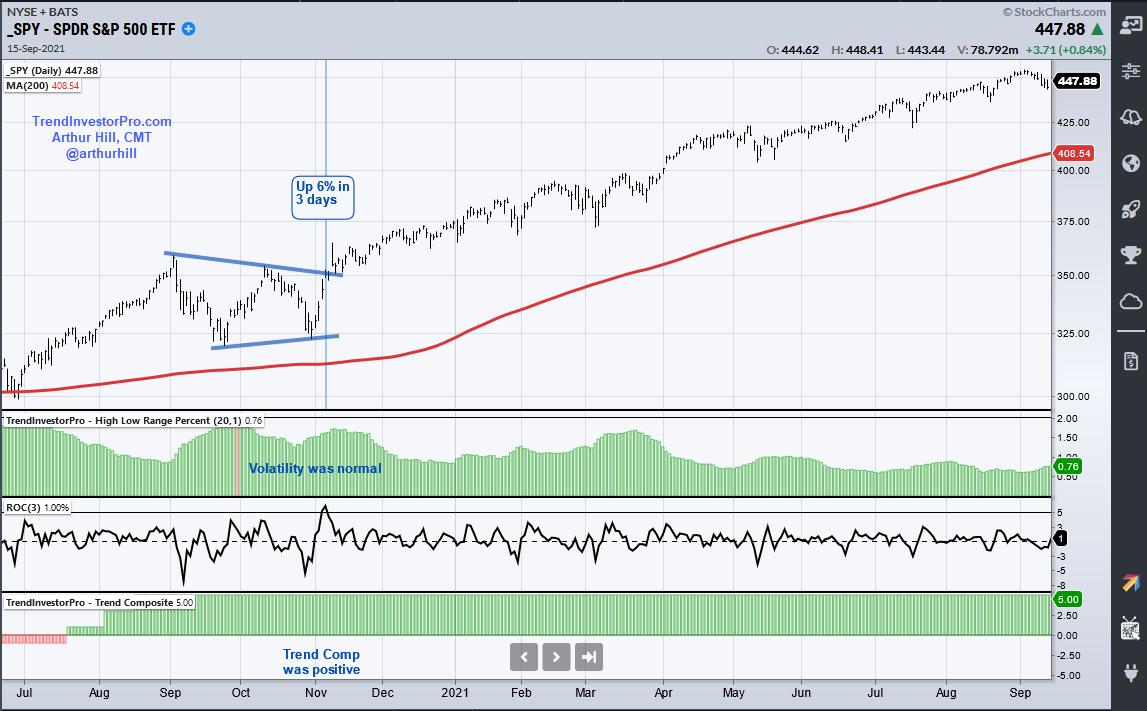
The chart below shows SPY above its 200-day as it consolidated in September-October 2020. The Trend Composite (bottom) window was also positive. Thus, the long-term trend was up. The middle indicator window shows the 3-day Rate-of-Change for reference. The top indicator window shows 20-day average of the High-Low Range percent, which is the high-low range as a percentage of the average price. This measures volatility and the indicator was below 2% at the time of the November surge (normal volatility). Thus, SPY was in an uptrend and volatility was normal as the ETF broke out of a triangle.
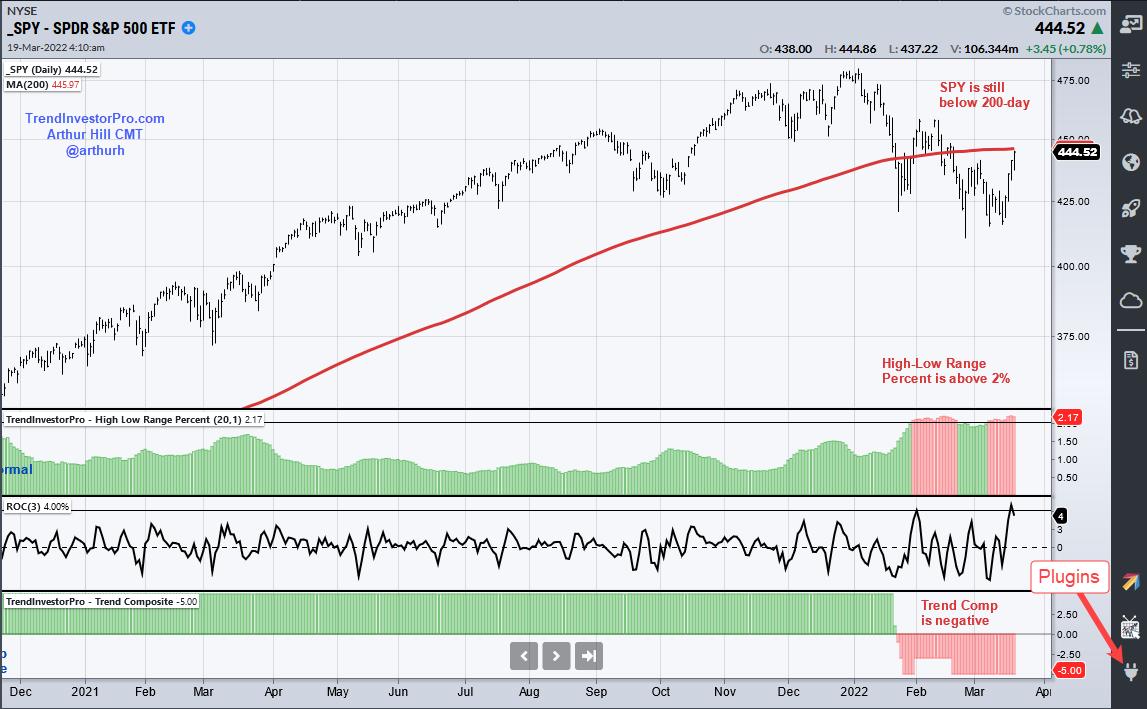
Now let's look at March 2022. First, SPY is below its 200-day SMA and the Trend Composite is negative. Thus, the long-term trend is still down. Second, the High-Low Range percent indicator has been above 2% for nine days (red) and this shows above average volatility (risk). This week's surge is impressive short-term, but SPY is still in a downtrend and volatility is above average. I would like to see a meaningful breakout and follow through before considering it as more than a bear market bounce.
This week at TrendInvestorPro I continued the Trend Composite trading strategy series with part five. This part tested a trend-momentum strategy using the 50 ETFs in the All Weather List. Click here for immediate access to this series and more.
On this week's Next Level Charting (video here), I used the High-Low Range percent indicator to quantify volatility in the S&P 500 SPDR (SPY), DB Energy ETF (DBE) and Gold SPDR (GLD). The latter two are in uptrends and experienced short-term parabolic moves.
The Trend Composite and High-Low Range Percent are part of the TIP Indicator Edge Plugin for StockCharts ACP. This plugin includes nine other indicators that help traders define the trend, identify tradable pullbacks and set stops. Click here to learn more.
---------------------------------------------------
Choose a Strategy, Develop a Plan and Follow a Process
Arthur Hill, CMT
Chief Technical Strategist, TrendInvestorPro.com
Author, Define the Trend and Trade the Trend
Want to stay up to date with Arthur's latest market insights?
– Follow @ArthurHill on Twitter


