We've rallied a TON off the February low, which is certainly encouraging. While I believe it's still possible that we print a new low sometime over the next 3-6 months, the significant rally over the past few weeks should not be ignored and increases the odds that our 2022 low has been set. In this article, I want to spell out the reasons why I'm not totally convinced of that bottom. I'll start off with one of my favorite technical friends -- relative strength.
Defensive Sectors Continue to Lead in 2022
A picture is worth a thousand words, right? So let me save some ink here and simply show you the weekly RRG chart for 9 of our 11 sectors. I'm ignoring energy (XLE) and materials (XLB) to focus on the relationship between the offensive sectors -- technology (XLK), consumer discretionary (XLY), communication services (XLC), industrials (XLI), financials (XLF) -- and the defensive sectors -- health care (XLV), consumer staples (XLP), real estate (XLRE) and utilities (XLU). All 9 of these sectors are reflected on this RRG chart vs. the benchmark S&P 500:
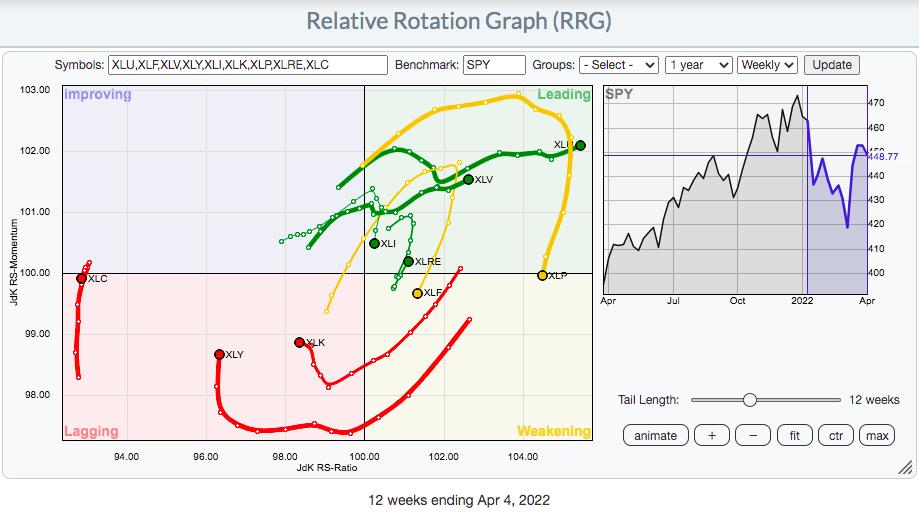
2022 has been the year of rotation from aggressive areas of the market to defensive areas of the market. Looking at the above RRG, how can you come to any other conclusion? While we do see the momentum improving for the three most important sectors - XLK, XLY, and XLC - they all are well left of the vertical axis, which is the axis that represents relative strength. We've seen very little turn back to the right, and the XLK looks like it's put on its left turn signal. So, yes the rally has been nice, but Wall Street has yet to seriously begin to move into technology and consumer discretionary, which is worrisome.
Inflation: The Worst Number Yet Arrives on Tuesday
At 8:30am ET on Tuesday, April 12th, prepare yourself. The annual core rate of inflation at the consumer level (Core CPI) is going to jump. The math is really easy to forecast; you look at the last 12 readings on the Core CPI and add them up. That's your annual rate. When a new monthly Core CPI number is released, you add it to the last annual reading, then subtract the one from a year earlier. Here are the last 18 Core CPI readings, plus an estimate for March 2022:
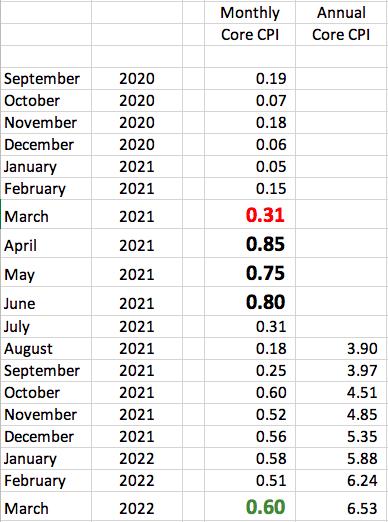
The big RED ".31" reading for March 2021 will likely be replaced by a higher March 2022 reading, which will raise the annual rate of core inflation to the 6.5% area. I've used the big GREEN ".60" reading as an estimate. The actual number will obviously change both the March 2022 monthly and annual numbers.
Next, I want you to focus on the upcoming April, May and June numbers. They will be replacing the monthly numbers from 2021 that I've included in big BLACK numbers. Those are extremely high readings that we haven't seen since. Every reading since June 2021 has been lower than those 3, meaning that the annual inflation rate will move notably lower over the next 3 months. That's why I've been saying that Tuesday's reading very well could be the peak of this pandemic-related inflation surge. It's also why I believe the Fed will back off of its rate-raising campaign. They've announced to the world that they're on "inflation watch", which helped calm the hyper-inflation worries of the 1970s. As the economy naturally slows, possibly tipping into a recession, I see the post-pandemic demand slowing, while supply chain issues lessen, effectively squashing inflation worries. As this takes place over the summer months, expect the Fed to hit the brakes on their "12 rate hikes ahead" rhetoric. That, in turn, will have investors pouring back into treasuries, sending the yields back down. As this transpires, expect growth stocks to SOAR later this year as the secular bull market regains strength like a hurricane over warm waters.
But patience will be required for this scenario to unfold.
Homebuilders, Truckers and Banks.....Oh My!
If you don't believe the stock market is prepping for a possible recession, then you haven't been watching these three groups. Higher treasury yields and mortgage rates are significantly lowering the expectations of home construction companies ($DJUSHB). Take one look at this chart and let me know if you see something different than me:
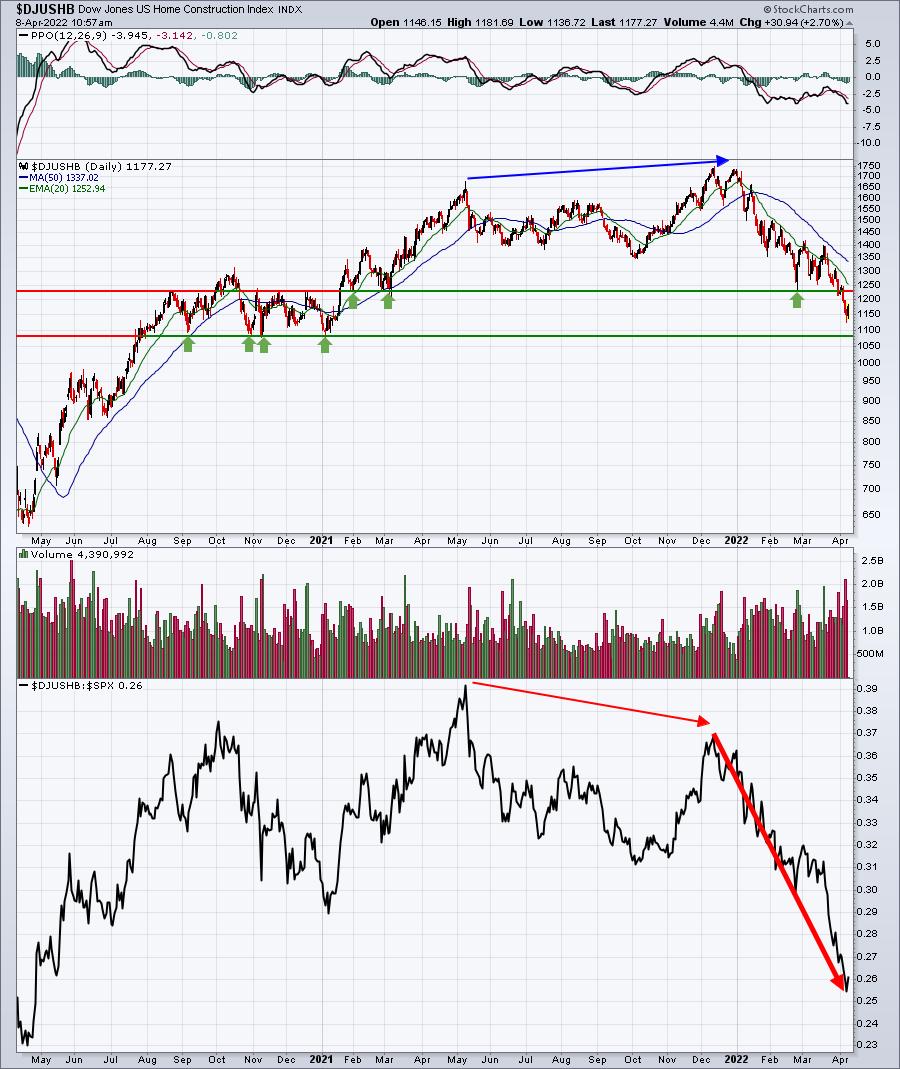
Notice how, even at the absolute price high in December 2022, the DJUSHB was losing relative strength? And 2022 has been downright horrific for home construction, free falling in terms of relative strength.
Are you expecting our economy to strengthen in 2022? Or at least be stable? Well, tell that to the truckers ($DJUSTK). Their business model is really easy to understand: they ship goods. When the economy strengthens or is expected to strengthen, they ship MORE goods. When the opposite is in play, they ship LESS goods. Check their chart out:
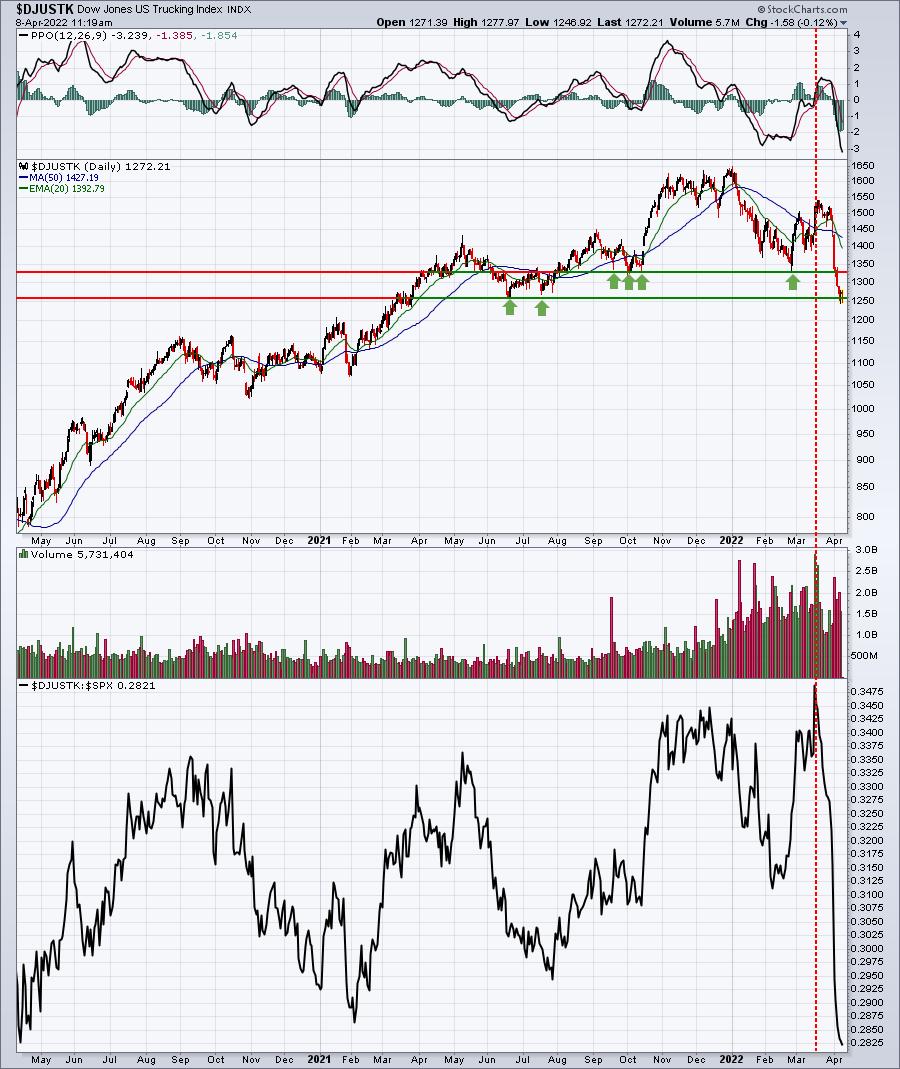
What the heck happened in mid-March? Just as the stock market bottomed and rallied strongly, the truckers' wheels fell off. In three weeks, the DJUSTK moved from a 3-year relative high to 3-year relative low. Clearly, Wall Street has undergone a complete makeover and truckers aren't a part of their current plan. Shouldn't we take notice?
Finally, we have the banks ($DJUSBK). There is plenty of talk about an inverted yield curve as the 2-year treasury yield ($UST2Y) has moved above the 10-year treasury yield ($UST10Y). Having audited banks in my prior career as a CPA, I'd rather follow the 3-month treasury ($UST3M) vs. the 10-year treasury, which appears to be much stronger. But no matter how we slice it, banks are performing very poorly, and that's a major concern:
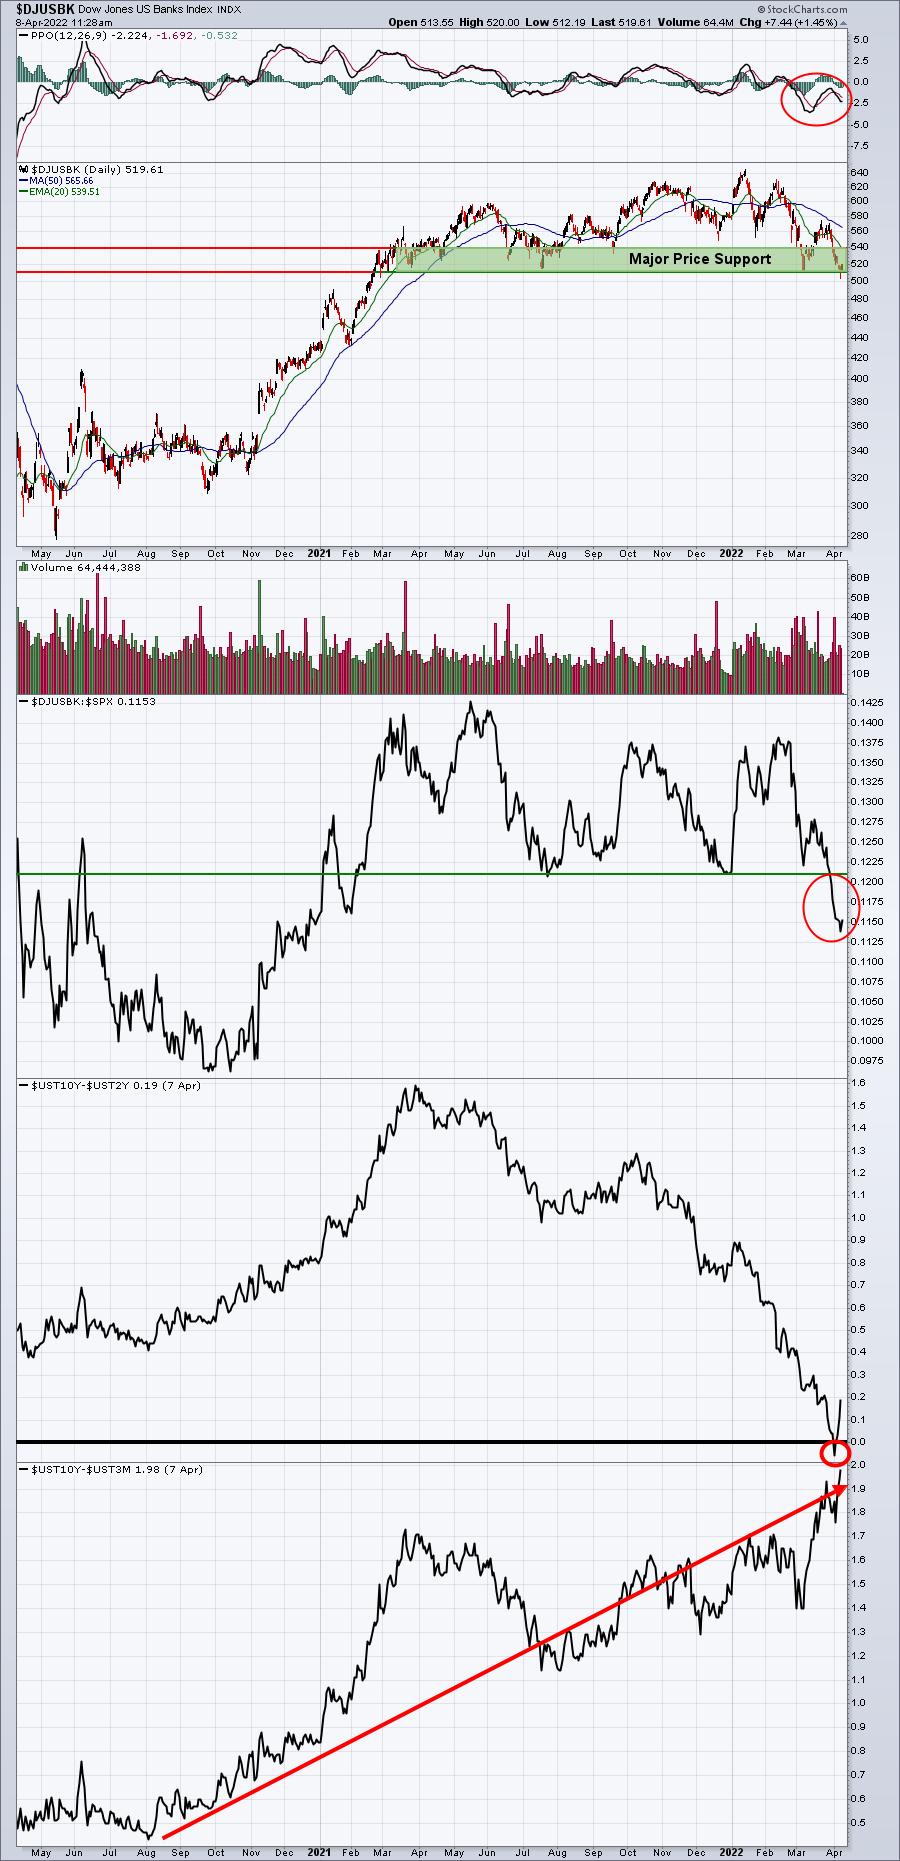
The two "inverted yield curve" calculations are much different. The former, using the 2-year treasury yield as the comparison, shows that yields did invert (small red circle), while the latter shows the yield spread at its highest level in the past two years. Which one is correct? I believe the bottom one is suggesting that, when the dust settles, banks will be an excellent choice during the next phase of this secular bull market. But in the very near-term, watch the key price support zone from 510-540. That's where selling has been contained many times over the past year. A breakdown beneath this support area could lead to much further selling and, ultimately, a much better buying opportunity.
It's Not All Bearish
I absolutely do NOT want to paint a super bearish picture. I said we'd get off to a poor start in 2022 and, indeed, quarter one was not pretty. Maybe the worst is behind us. Long-term investors should stay the course, in my opinion, as any further weakness in 2022 is likely to be followed up by a very strong rally later this year and into 2023. Of course, that's just my opinion. We all know anything can happen. But based on my work, research, and study of history, I'm convinced the odds point to a very strong rebound once this current mess clears.
On Monday, I plan to write an EB Digest article about one area of the market that I expect to flourish in the second quarter. Wall Street has endorsed the group as a leader, so don't be surprised to see further strength in the weeks ahead. If you're not currently an EB Digest subscriber, CLICK HERE to start your FREE subscription with only a name and email address. There's no credit card required and you may unsubscribe at any time.
Happy trading!
Tom


