Read or listen to any financial media outlet and you're likely to hear the words "inverted yield curve." What does that mean and, more importantly, what does it mean for your investments?
The shape of the yield curve may not have made the top of your list of discussion topics at past holiday parties. But this year, it might make it to the number one spot. People are feeling inflation pain, they're concerned about higher interest rates, and they're worried the economy may plunge into a recession. So, it may be a good time to brush up on why it's important to understand the dynamics of Treasury yields, and what it means when the yield curve inverts. But before diving into the inverted yield curve, it may be helpful to understand the yield curve in general, namely its typical shape and what its shape indicates.
What is a Yield Curve?
A yield curve is a chart of bond yields. Although yield curves can be created for any bond, investors and traders pay attention to the U.S. Treasury yield curves. Why? Because they represent the interest rate the U.S. government pays to borrow money, which varies depending on the time and length of the loan. Typically, longer-term loans will carry a higher interest rate than shorter-term loans. In this scenario, the yield curve would slope upward—an indication of economic expansion. But economies don't always expand. Sometimes the yield curve is flat, which could be a sign of a slowing economy with modest growth. Once in a while the yield curve inverts, which can be a sign of a weakening economy. When the yield curve flattens or inverts, the relationship between yield curves and recessions can get a little complicated.
Why Pay Attention to the Yield Curve?
The yield curve gives you a "big picture" view of the stock market and the health of the overall economy. When interest rates rise, mortgage rates, car loans, or any other types of loans rise in tandem. And that can impact consumer confidence levels. Lending slows, businesses invest less, and people buy less. All these factors could lead to slower growth.
When investors start to worry about a slowdown in the economy, they generally consider investing in long-term bonds. The increase in demand sends long-term bond yields lower. Demand for short-term bonds decreases and the lower demand sends short-term Treasury yields higher.
Bond prices and yields move in opposite directions. When bond prices rise, yields go lower.
Another factor also plays into the dynamics—the Fed. When the Fed raises rates, short-term bond yields move higher.
If long-term bond yields are unchanged and short-term yields rise, the yield curve will likely flatten. But sometimes, a fall in demand and the Fed's decision to raise rates can result in an inverted yield curve. This is the opposite of what typically takes place during an economic expansion, which is why an inverted yield curve could be a sign of a potential recession.
Economists often look at the spread between the ten-year Treasury note rate and the three-month Treasury bill rate (see chart below) as a recession predictor.
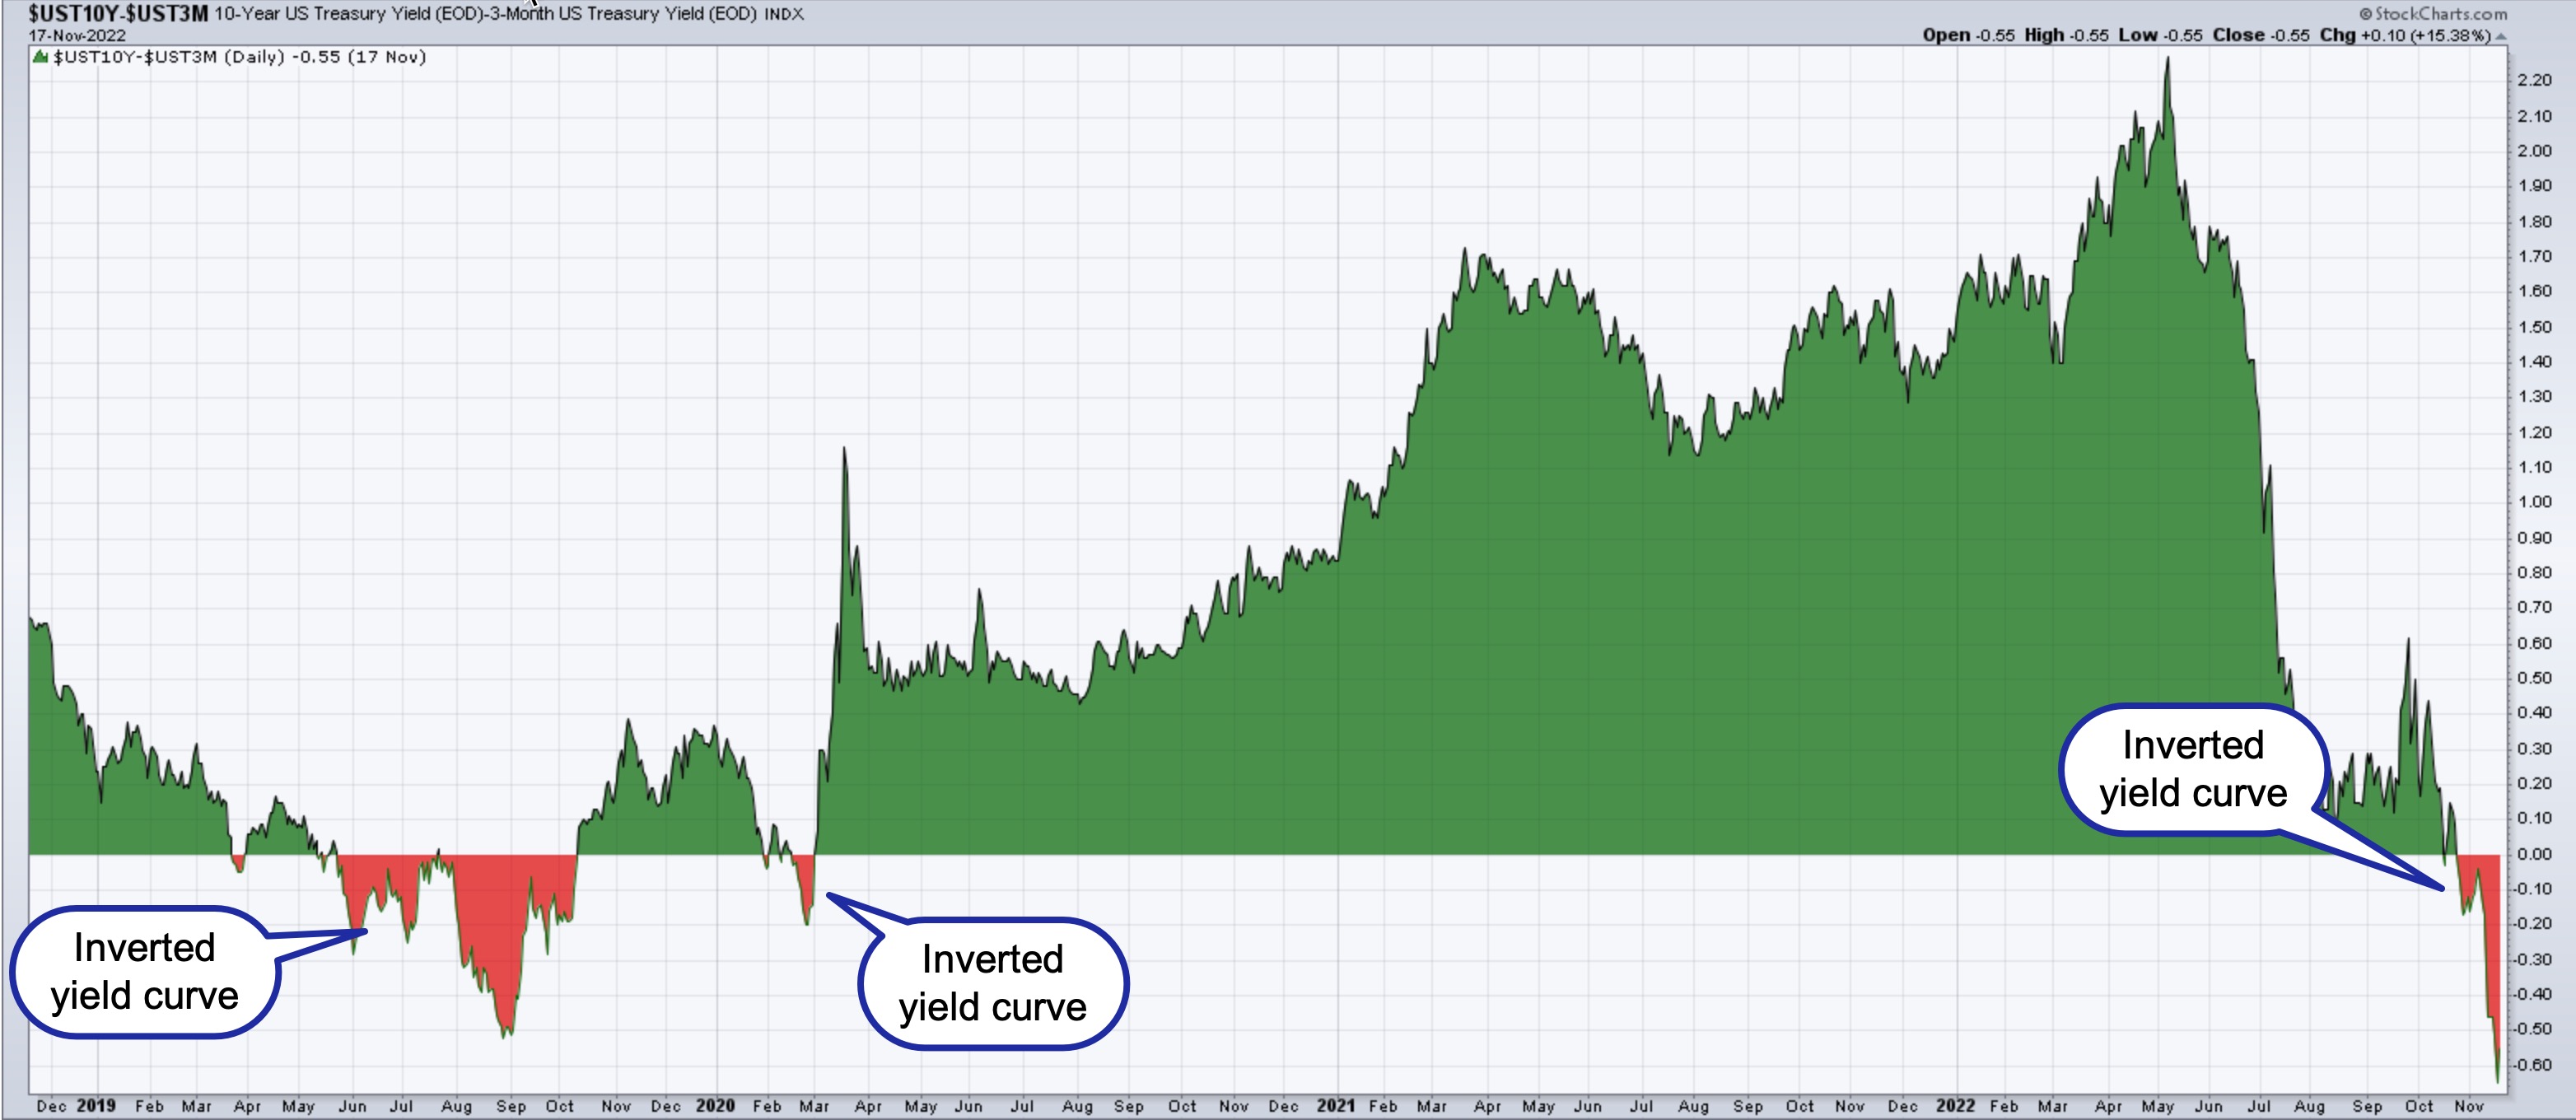
CHART 1: SPREAD BETWEEN 10-YEAR AND 3-MONTH U.S. TREASURIES. The spread between the longer ten-year Treasury note and the three-month Treasury bill is in negative territory, implying the yield curve is inverted. The last time we saw a yield curve inversion was back in 2019 and briefly in 2020 before the COVID-19 outbreak. Source: StockCharts.com
From the chart above, you can see the yield curve has inverted. The general thinking is that, when the Fed tightens interest rates too much, the yield curve inverts. We're seeing that play out. As we heard from the last Fed press conference, the Fed is worried about high inflation and will keep tightening until inflation comes down to an acceptable level. But it takes time to feel the full effects of the Fed's tightening, which is why the yield curve can act as a leading indicator.
There are other ways to look at the yield curve. You can look at the spread between the ten-year and two-year Treasury rates. Julius de Kempenaer, chief technical analyst at StockCharts, stated, in a recent StockCharts TV segment of his show Sector Spotlight, "When the 10-year yield is lower than the two-year yield, it means that giving your money to the government for two years gets you a higher yield than giving your money to the government for ten years." Yield curve inversions may not happen often, but they're not impossible.
Does an Inverted Yield Curve = Recession?
Not always. If you go back 40 years, every time the 10-year rate fell below the three-month one, more often than not, a recession followed. But it didn't happen every time. For example, the last time we saw an inversion in the ten-year and three-month yield curve was in 2019. At the time, there were fears that perhaps the expanding economy following The Great Recession could be slowing down or coming to an end. But it didn't really pan out that way in the long run. There was a short time after the COVID-19 outbreak when concerns rose about the potential of a global recession, but the stock markets rallied after that.
It can take several months or a year or two before the effects of monetary policy are felt. Sometimes, a recession may not even happen. So, instead of looking at the yield curve as a recession predictor, think of it as an indicator that paints a picture of overall economic conditions.
Seeing the stock market come off its lows is exciting. While it maybe tempting to adopt the "buy the dip" mentality, always keep the big picture in mind. A stock market that appears to be strengthening in a time of economic uncertainty may not be sustainable. That's not to say you shouldn't trade; it just means that, if you do want to add positions to your portfolio, do so knowing that economic fundamentals may not be aligned with the stock market.
We're going through an inflationary period, interest rates are rising, and geopolitical tensions continue. Interest rates are probably going to rise more. We got a hint of that from comments made by St. Louis Fed President James Bullard, who suggested the Fed may have to raise rates to 7% before we see a Fed pivot. That may be a long way off.
Let's hope that's not the case. Regardless, given current uncertainties, it's best to keep the yield curve in your rearview mirror. Have a risk management strategy in place—protect your winning trades using stops, recognize when your emotions influence your decisions, and be disciplined. Ultimately, your goal is to protect your portfolio. Understanding relationships between macro factors and making trading decisions based on those relationships makes you a smarter trader and investor.
How to Track the Yield Curve on StockCharts
The most direct way to track the yield curve is:
- Login to your StockCharts account
- Select your preferred chart type—SharpCharts, StockChartsACP, and so on
- Enter $UST10Y-$UST3M in the symbol box
- Try out different chart types from the Type dropdown menu
- Select overlays and indicators from the respective dropdown menus
- Save the chart to your ChartLists
For more ideas, be sure to check out the StockCharts in Focus video below.
Keep an eye out for our Cyber Monday sale, coming soon.

For more ways to track yield curves and interest rates, be sure to check out the StockCharts in Focus video below.
Happy charting!


