
Warning! Inclement weather at the North Pole might impact Santa's trip to Wall Street.
As the end of the year approaches, you're likely to hear the term 'Santa Claus rally" come up often. But what exactly is it, and how can traders and investors benefit from it?
What Is the Santa Claus Rally?
According to the Stock Trader's Almanac, the Santa Claus rally is a short, sweet, and respectable rally that takes place within the last five trading days of the year and the first two trading days of the following year. And it tends to happen almost every year. But let's face it; the stock market's performance in December 2022 has been grim and doesn't give much hope for a potential rally. Many investors are wondering if Santa may have a hard time making it out of the North Pole.
That said, in the markets, anything is possible.
Why does the Santa Claus rally happen? One theory is that, at the end of the year, investors sell off their losing positions to take advantage of tax-loss harvesting. With the cash received from the stock sales, investors turn around and buy stocks in the hope of earning returns. Another theory is that it has to do with the general optimism that's associated with the start of a new year.
The U.S. broader markets are at a critical juncture and could go either way. The S&P 500 Index ($SPX) is at a 38.2% Fibonacci retracement level. A break below it could take it to the October lows, or even lower. The Dow Jones Industrial Average ($INDU) is sitting at its 50-day moving average. If $INDU breaks below the MA it could go much lower. And the Nasdaq Composite ($COMPQ) continues to struggle. It's been a pretty ugly time for technology stocks, so even a short rally could be a nice gift.
There's an interesting pattern developing in $COMPQ (see below). Bring up a weekly chart (at your own risk) to see how far $COMPQ could drop. Due to the risk of ruining your holidays and the optimism that surrounds the new year, we've refrained from posting the weekly chart here.
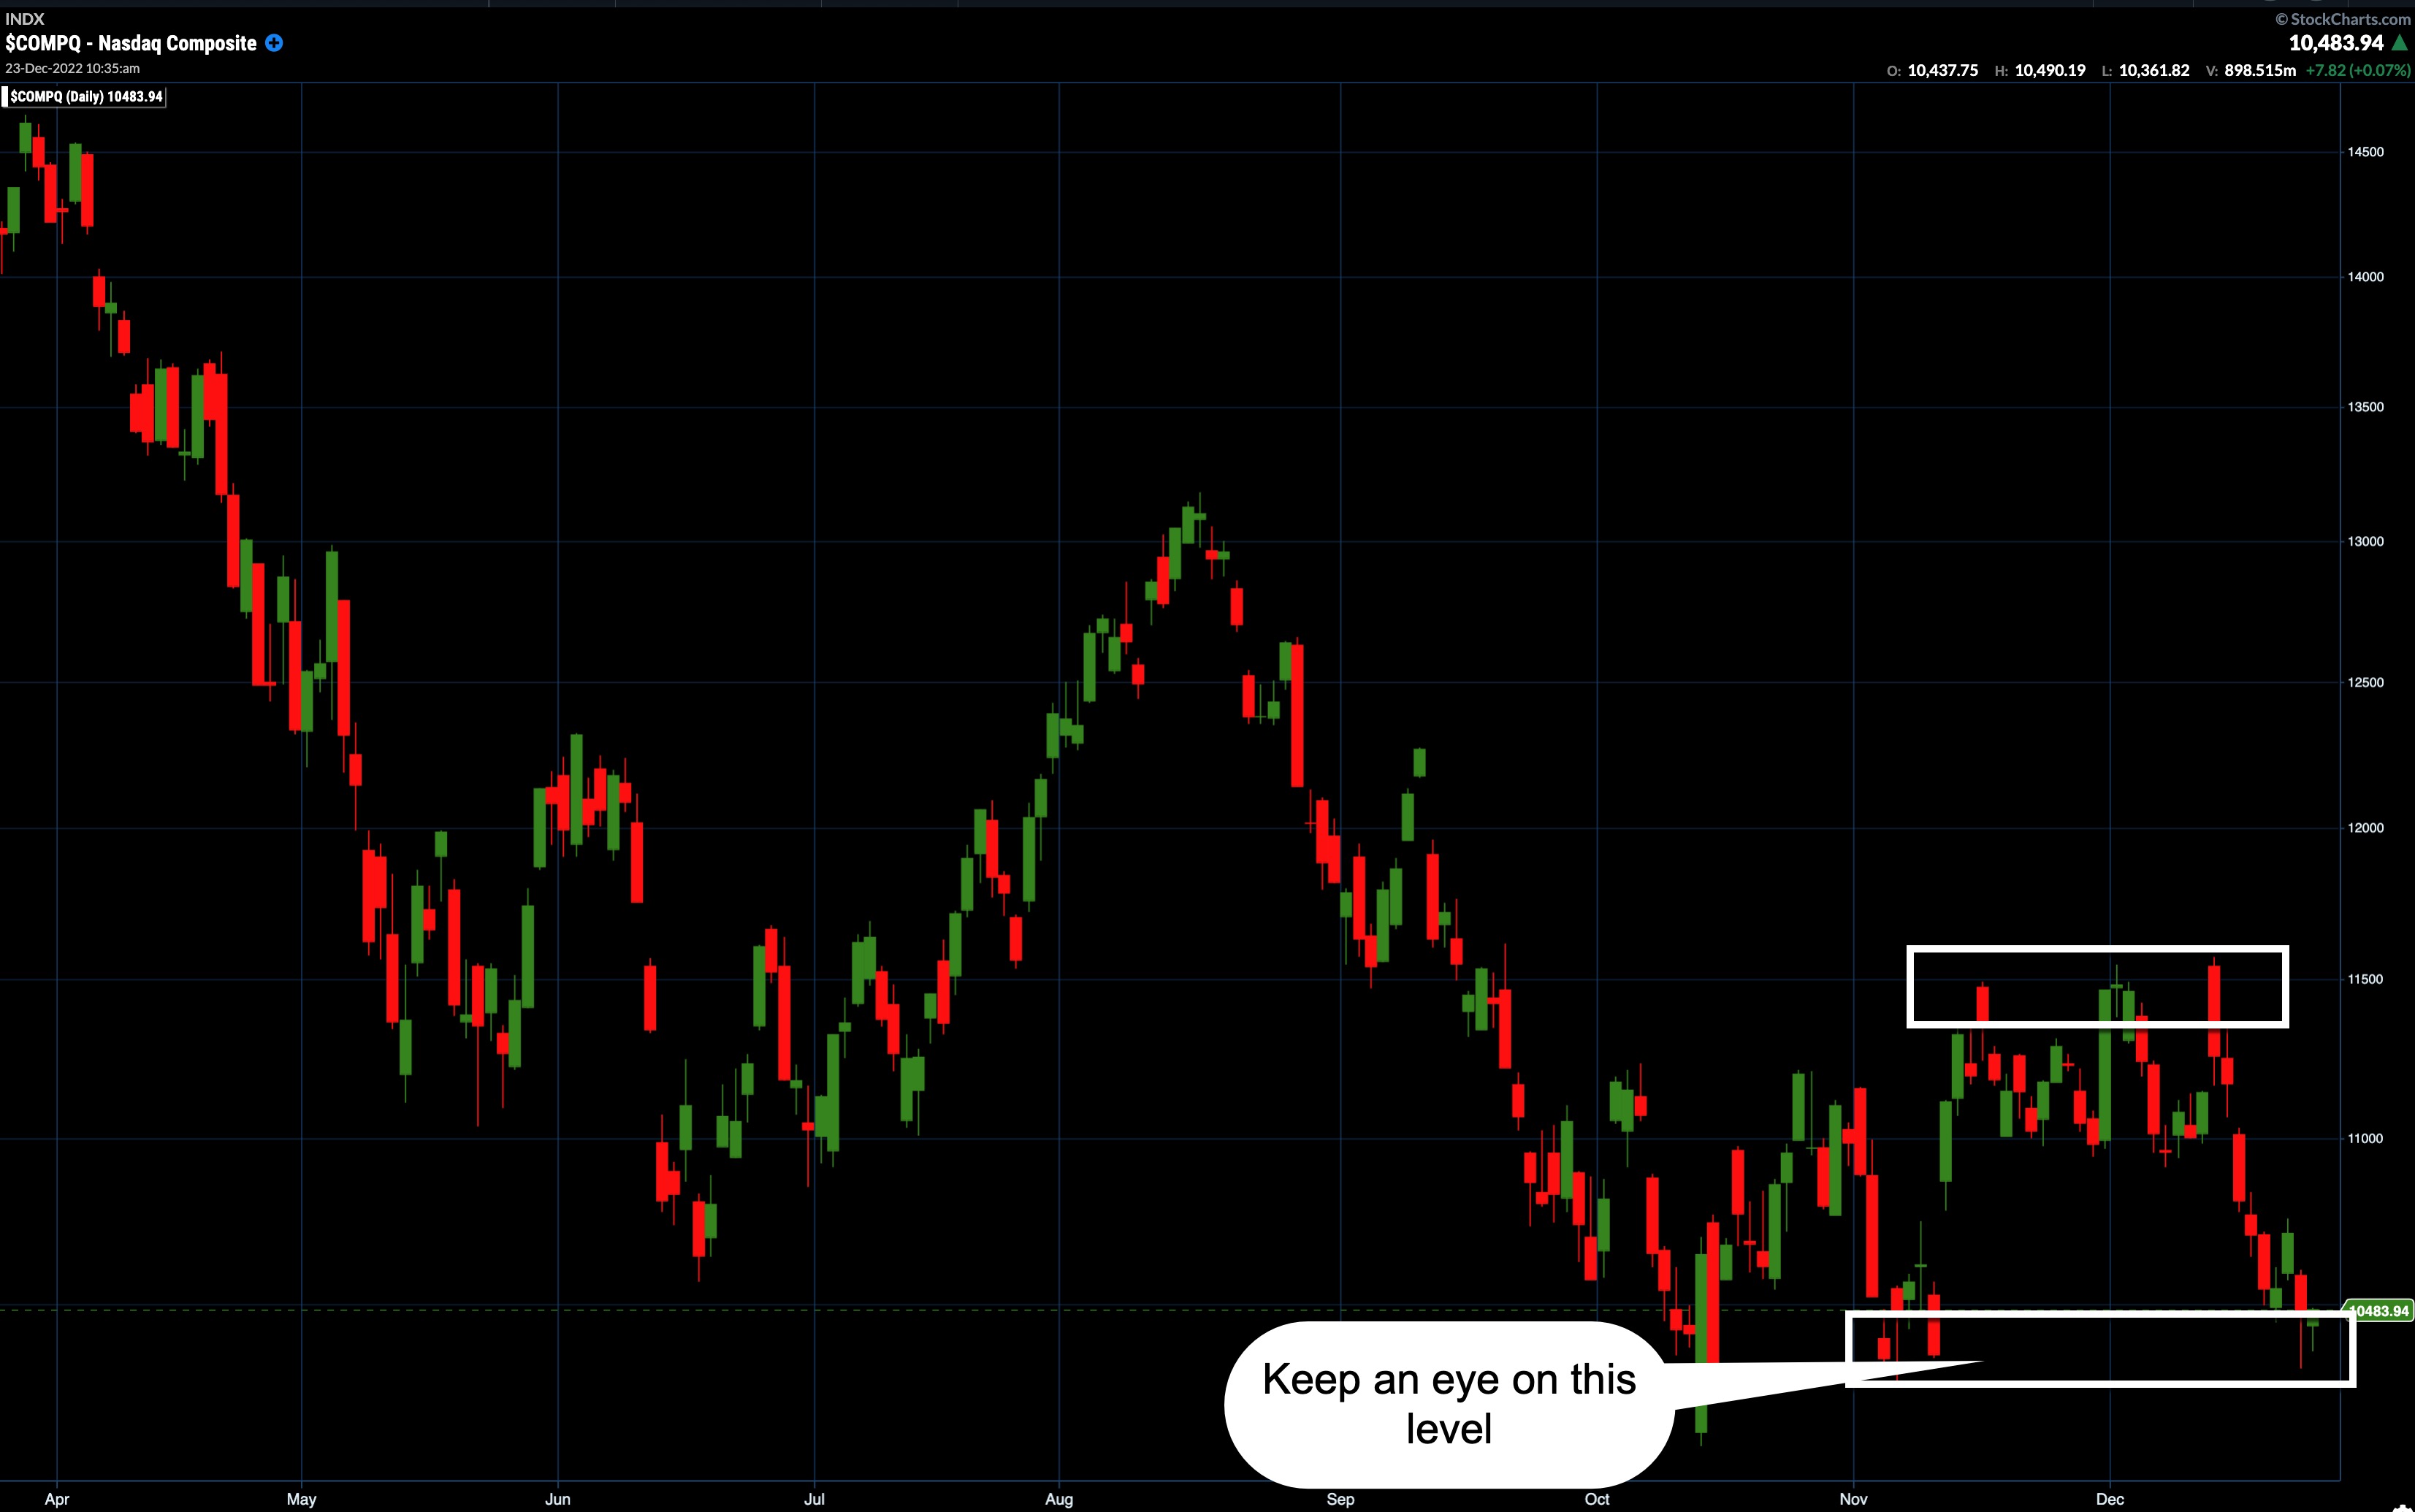
CHART 1: NASDAQ COMPOSITE AT A CRITICAL LEVEL. A break below the 10,350 level could mean the index will fall further. But, if this level holds, there might still be a Santa Claus rally. Chart source: StockChartsACP. For illustrative purposes only.
If Santa Shows Up...
If the critical levels in the broader indexes hold and the markets experience the short-and-sweet rally, you may want to take advantage of some trading opportunities. Here's one way:
- Log in to your StockCharts platform, then select Your Dashboard to get an overview of the overall market.
- Scroll down to Sector Summary in your Member Tools section (you'll find it under Summary Pages).
- Select the top-performing sector and drill down till you find a stock or exchange-traded fund that meets your trading criteria.
- Review the chart and, if your technical indicators confirm an upward move, you could put on a short-term trade. But things could move in the opposite direction, so be diligent in applying stop-losses.
Even though the odds of a Santa Claus rally are high, it's not a sure thing. If you happen to be trading during the holiday season, keep an eye on those critical levels in the broader indexes. If Santa does show up on Wall Street, remember that the rally has a very short duration.
If Santa Claus should fail to call, bears may come to Broad and Wall. — Stock Trader's Almanac

Jayanthi Gopalakrishnan
Director, Site Content
StockCharts.com
Disclaimer: This blog is for educational purposes only and should not be construed as financial advice. The ideas and strategies should never be used without first assessing your own personal and financial situation, or without consulting a financial professional.
Happy charting!


