Three big bellwether stocks announced earnings on the same day, after the close, and they all missed estimates. Does this mean the Technology sector or the broader market will head lower?
Not necessarily. From a technical perspective, ahead of earnings, the charts of Alphabet (GOOGL), Amazon (AMZN), and Apple (AAPL) were leaning towards being bullish. Here's a technical perspective.
Alphabet (GOOGL): What to Watch Out For
GOOGL's breakaway gap on February 2 indicates some significance for the following reasons. It betrays strong bullish sentiment on the day it's slated to report earnings after hours. It also places share prices above three critical levels of resistance:
- The 200-day moving average
- The December 2 (2022) high leading to the most recent rounding bottom, and
- The October 25 high preceding the bearish swing, which brought GOOGL stock to its lowest 12-month level.
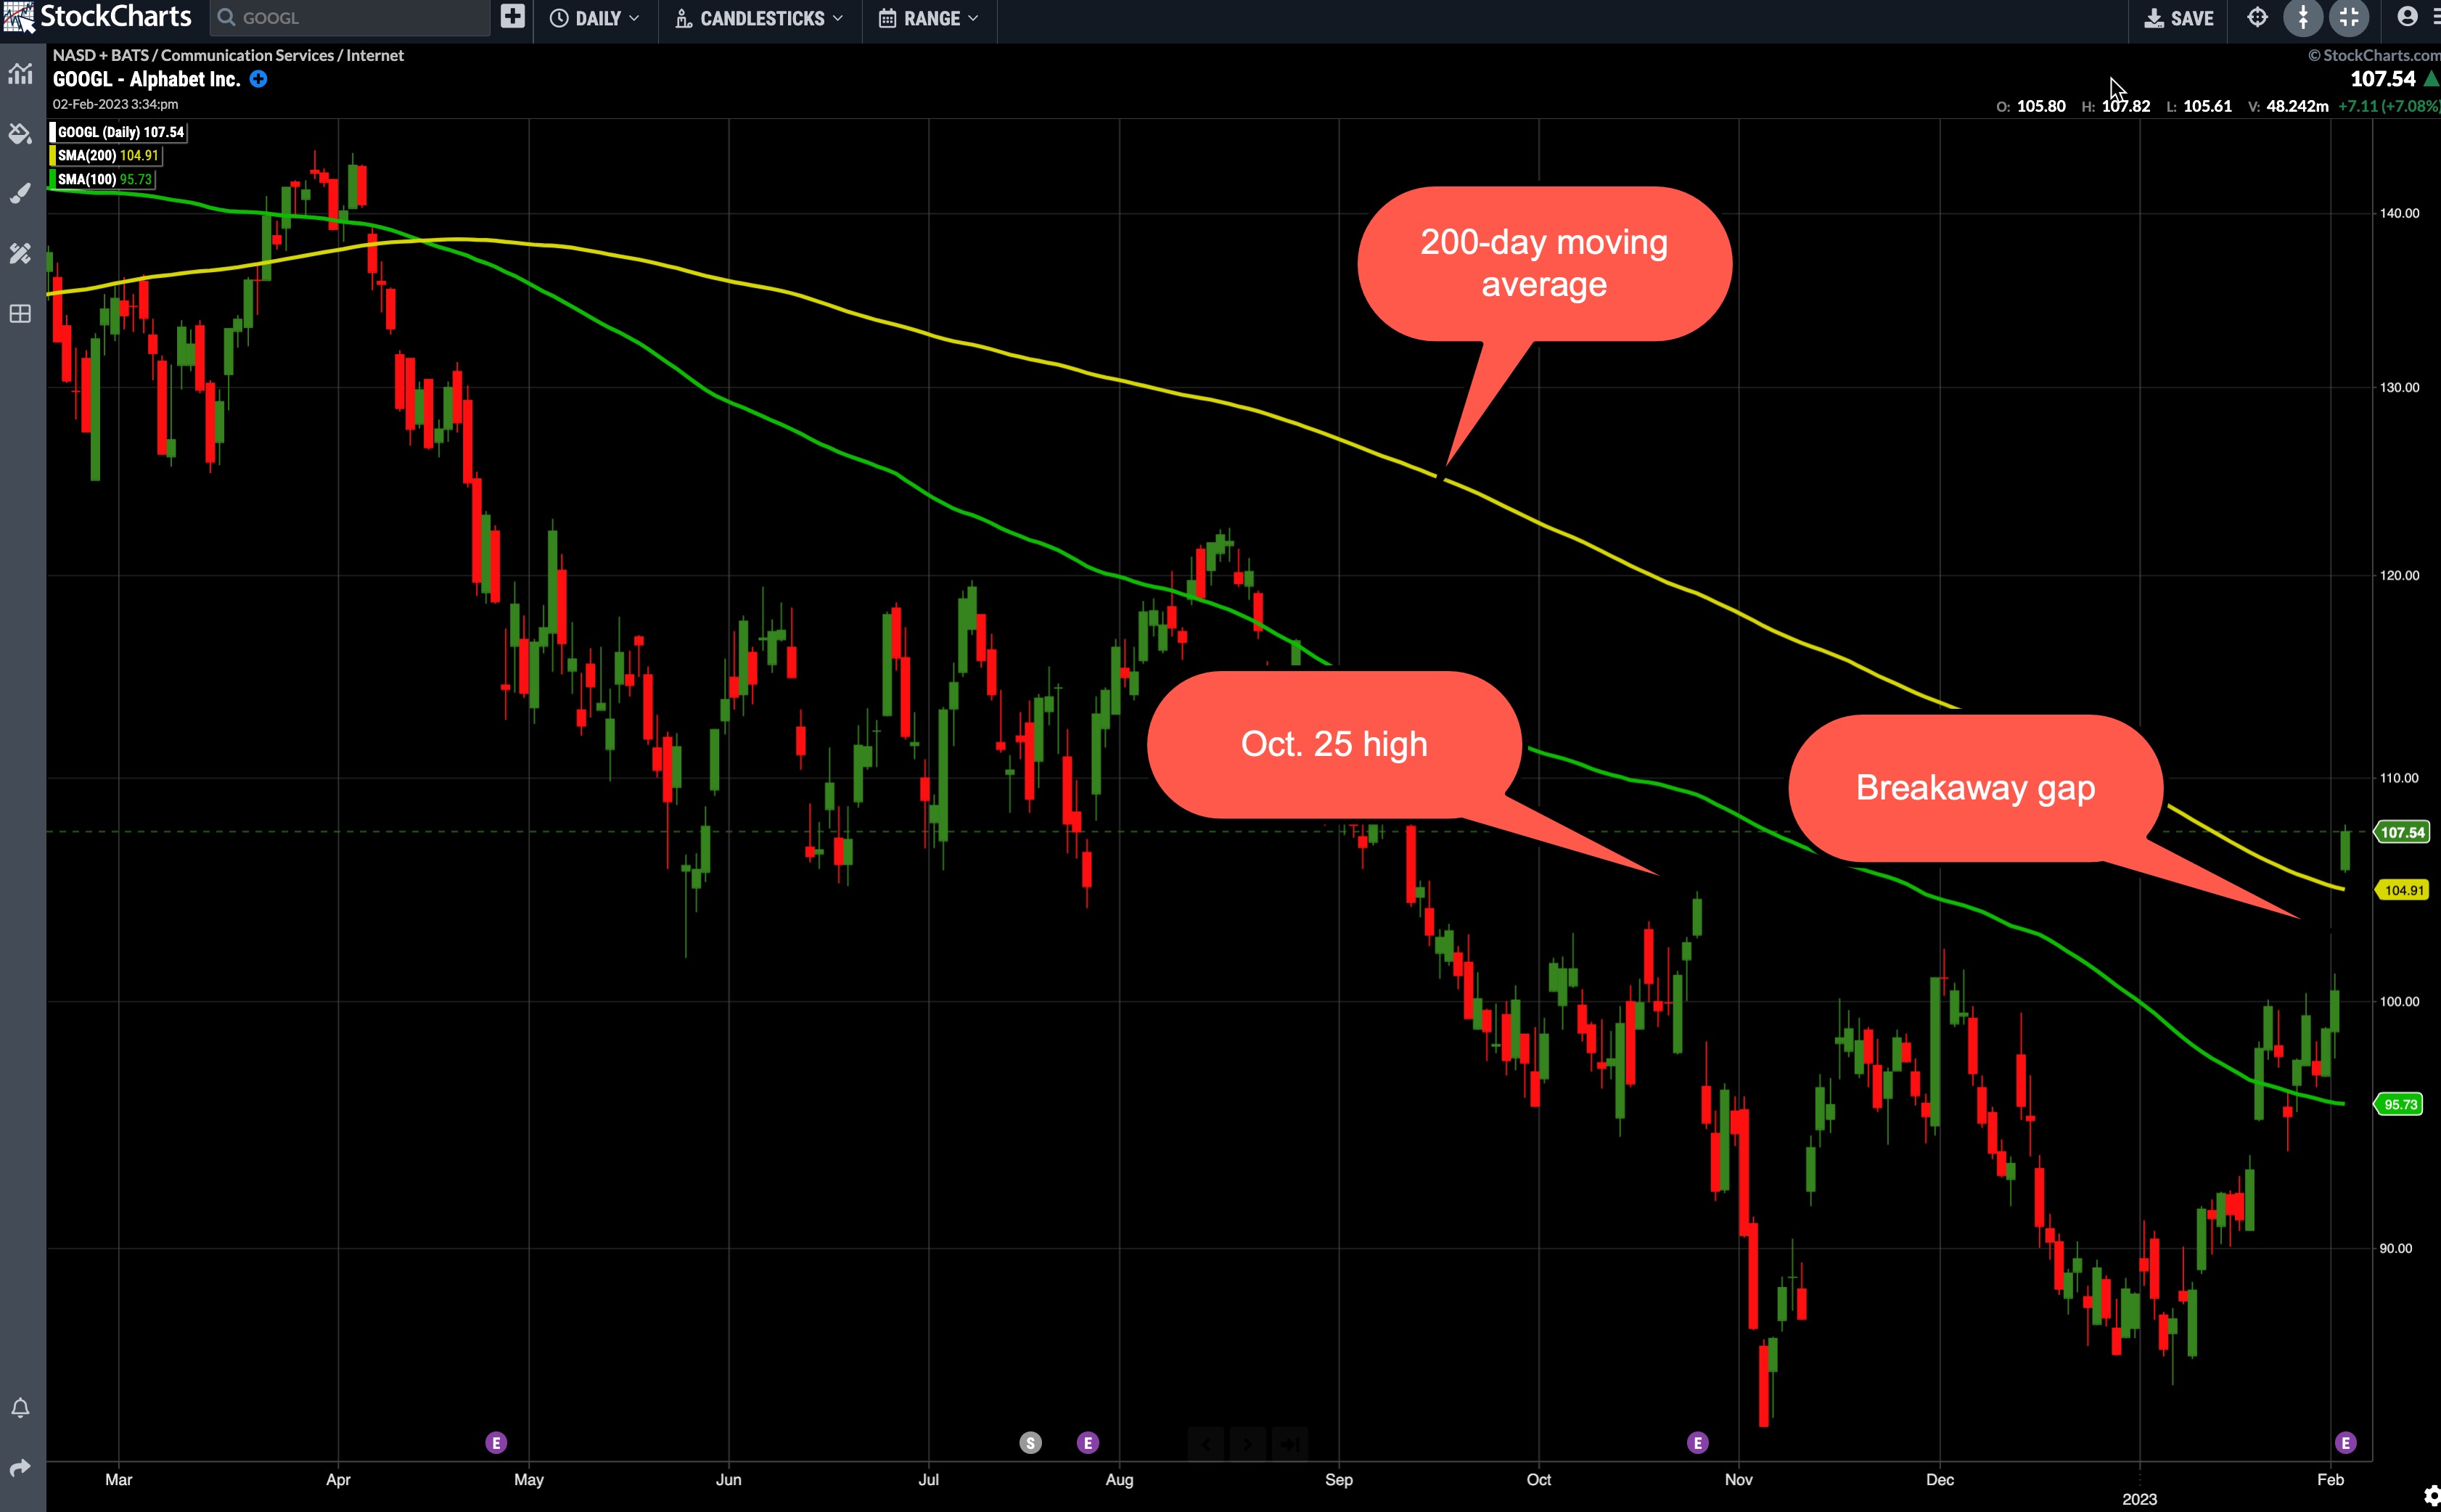 CHART 1: WILL GOOGLE STAY ABOVE ITS 200-DAY MOVING AVERAGE? We'll see how the stock reacts after its earnings report. If it goes above it, the 200-day MA could become a support level. Chart source: StockChartsACP. For illustrative purposes only.
- Depending on the scenario, gaps often get filled, and the outcome following the fill depends on whether the initial bullishness was driven by real anticipated value or overextended exuberance.
- For the current swing to develop into a stronger trend, GOOGL should remain above its 100-day moving average.
- A move below the January 6 swing low (at 84.86) would likely invalidate any uptrend thesis.
Amazon (AMZN): What to Watch Out For
Adding the Ichimoku cloud overlay to the price chart takes care of some of the critical points a trader should be looking for. The cloud helps identify trend direction, support, and resistance levels.
While Amazon's stock price may be tempting to buy given it gapped up to its 200-day moving average, it's best to take a step back and look at the bigger picture (see chart below).
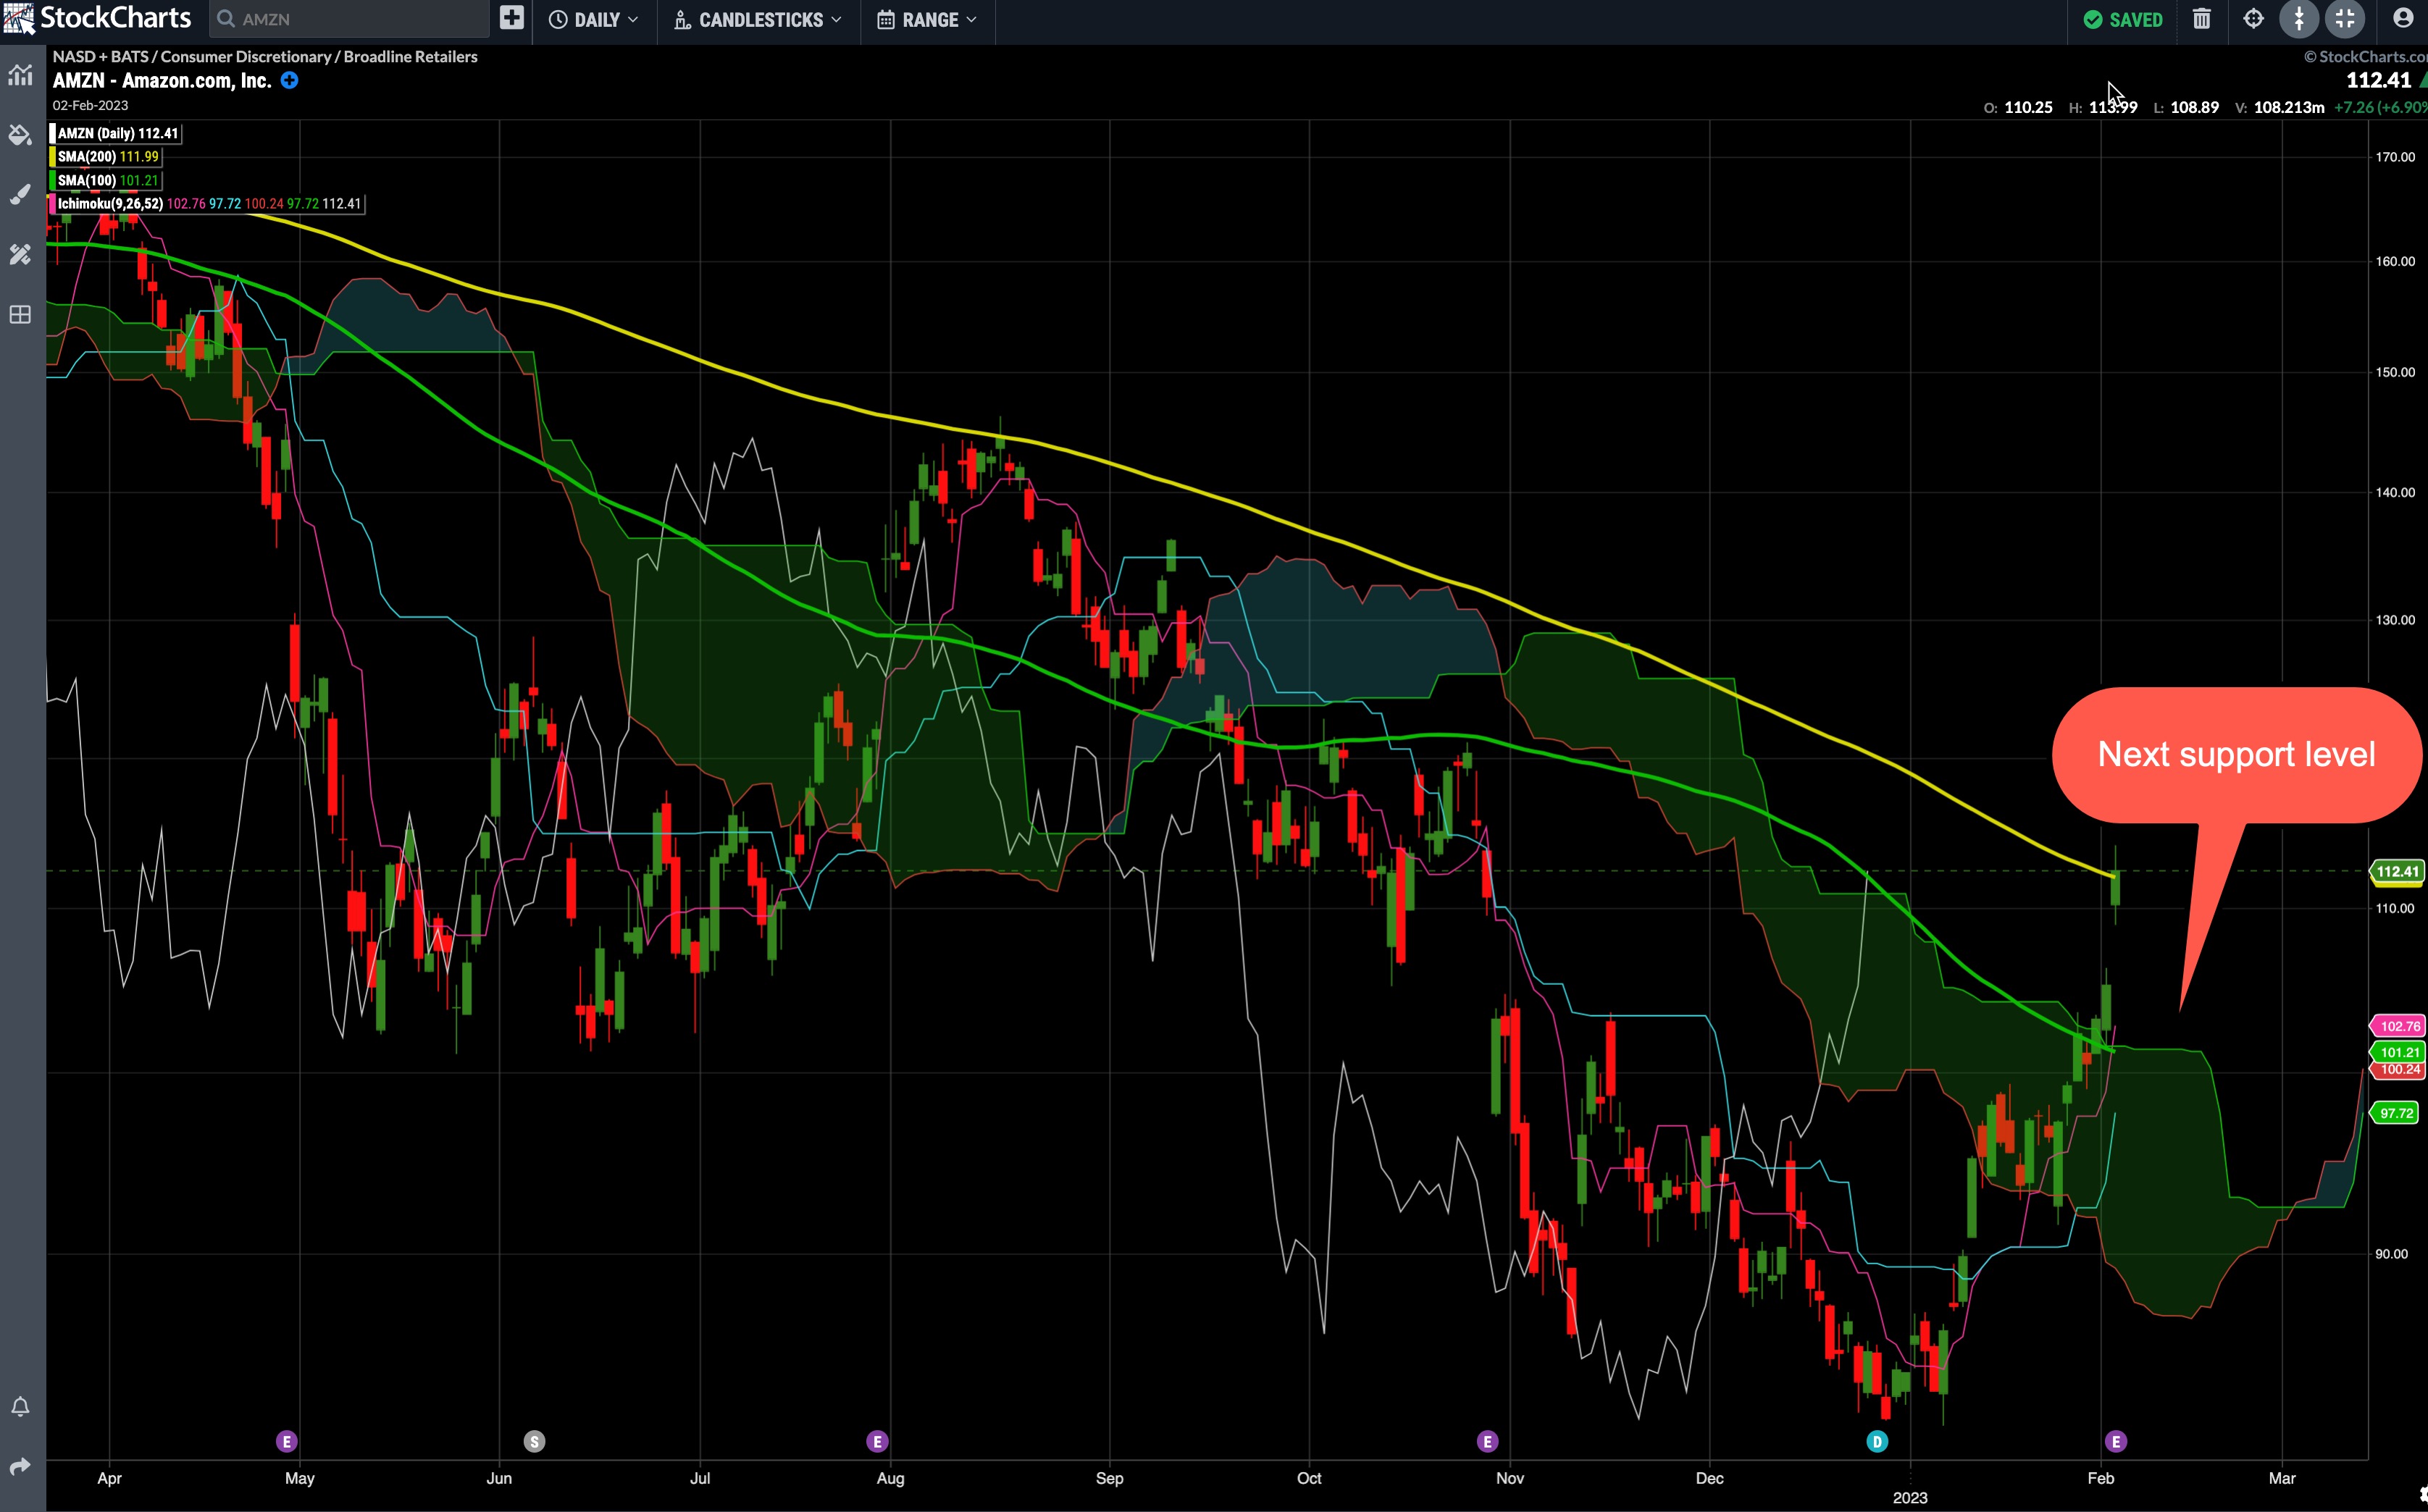
CHART 2: AMAZON IN THE CLOUD. The Ichimoku cloud overlay identifies support and resistance levels and trend direction. Chart source: StockChartsACP. For illustrative purposes only.
Consider the following:
- Price is trading above the shaded band, which means the top line of the band (green line) would be your first support level. The bottom band line (red line) would be the second support level.
- The base line (cyan) can be used to confirm a trend. Since AMZN's stock price is above the base line, it's an indication that price could go higher.
- The conversion line (pink) is another trend confirmation indicator. The direction of this line coincides with trend direction. In the chart of AMZN stock, the pink line is trending higher, which is another positive for the stock price.
There are many other ways to use the Ichimoku cloud indicator but its main purpose is to act as a measure of future price movement which is why you see the cloud extending beyond the prevailing price bar. You can see a bullish cloud forming with the red line above the green line. There's also a lagging span line (white). While it's lagging, it still is useful in identifying price direction. It's trending up and is above the price charts from 26 bars ago. That's another positive indication.
Any reversal in any of these lines or a reversal in the crossover should alert you to a potential reversal in price direction.
Apple (AAPL): What to Watch Out For
Out of the three, Apple's stock price has held up pretty well. Since reaching a high in January 2023, the stock price has seen slightly lower highs and lows but the stock has held above its 50% Fib Retracement levels (see chart below).
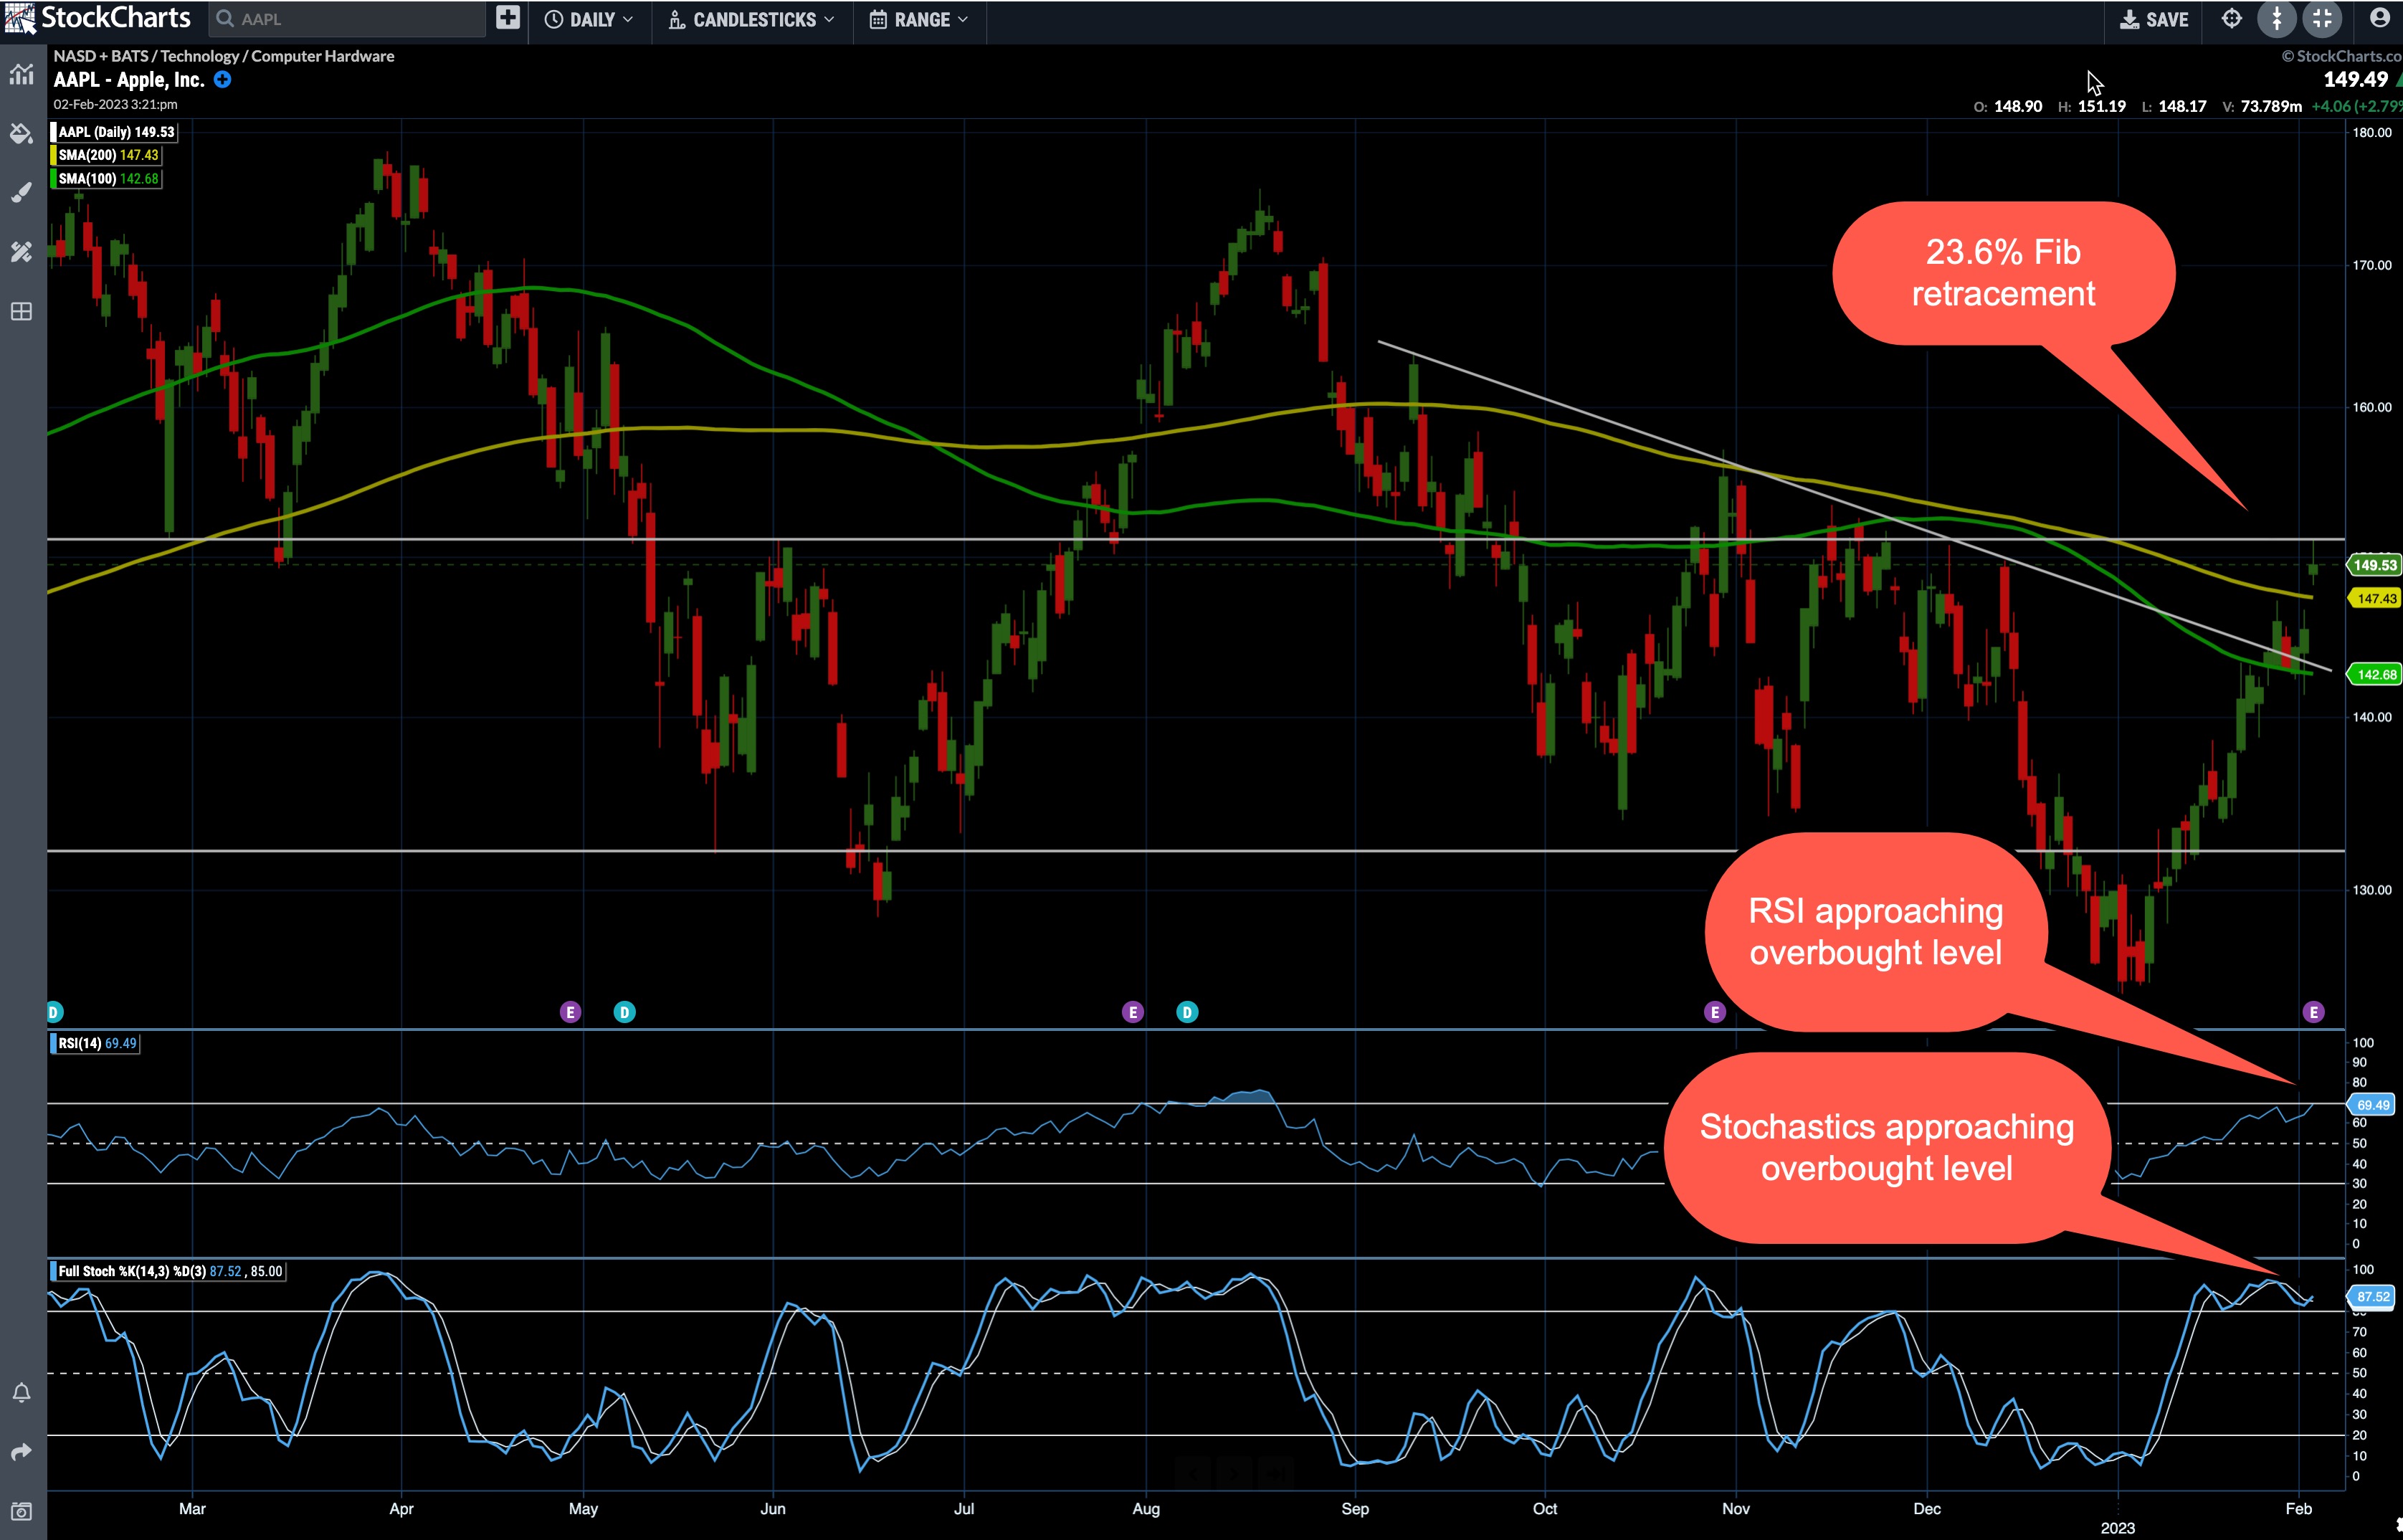 CHART 3: A BULLISH BIAS IN APPLE? The stock price is approaching its 23.6% Fib retracement level and there's a chance that price could move higher. Chart source: StockChartsACP. For illustrative purposes only.
- If you look at the Fib retracement levels from the 2020 low to the January 23, 2022 high, price is approaching its 23.6% level (upwards), having bounced slightly above the 50% retracement level. If Apple's stock price crosses above it, then it would likely become a support level, considering it's been tested as a resistance level about five times since 2021.
- Note that from December 13 to the present day outlines a V Bottom. If Apple stock pulls back in the next few days to test its V bottom neckline (white trendline), you at least have some idea as to the prevailing market sentiment, which currently leans bullish.
- The relative strength index (RSI) and stochastic oscillator indicate that AAPL may be approaching "overbought" levels. That might make you think that prices may pull back but remember, these oscillators can sustain oversold readings for a lengthy period of time (so exercise caution).
Another thing to consider: Apple's earnings, along with those of Amazon, Alphabet, and other stocks within or correlated to big tech may play a significant role along with or despite the prevailing technical readings. This is a case where fundamentals may or may not play along with trader sentiment as revealed by the pre-earnings technical setup.
Trade With Caution
Earnings are tricky to trade, particularly for those attempting to enter early on to catch the upside. Based on the Nasdaq's performance compared to the S&P and Dow, the overall market bullishness seems to be favoring tech-heavy names. Today's triple earnings, following Meta's positive surprise, may boost all three stocks. But they could also pull back to their support levels. So, just set your stops before you enter any trades.
Disclaimer: This blog is for educational purposes only and should not be construed as financial advice. The ideas and strategies should never be used without first assessing your own personal and financial situation, or without consulting a financial professional.
Happy charting!
Happy charting!


