
The US consumer price index (CPI) came in slightly higher than expected; the market's been pretty chill about it so far. But will that change?
Inflation may be eating into your bank account, but you can stop it from taking a chunk out of your portfolio returns. Since the last Fed interest rate decision, investors have been looking forward to a Fed pivot. But the big question is when's that likely to happen. Inflation in the US is still high, and, when that's the case, it's natural for investors to be hesitant about investing in the stock market. The Fed indicated in their last meeting that they'd likely be slowing the pace of rate hikes, but will inflation numbers support this idea?
Every Inflation Is Different
Two inflationary periods aren't alike. Some interesting data points rise to the surface when you take a deeper dive into the January CPI data. Even though inflation is trending lower, rent remains very high. Shelter prices were up the most in January. Food and gas prices were also high, as was natural gas ($NATGAS), although that may come down in February, given that nat gas prices went through a steep slide.
The upside—shelter costs have been declining. Rent has been coming down, and we've seen a little softening in housing demand, although not enough to warrant shelter prices coming down. Core services such as healthcare, personal care, and home services have also been pretty high. Then there's the job market, which continues to be tight. To give weight to some of these areas that are still seeing higher prices, the Fed gave importance to the buzzword "supercore inflation," a term we're likely to hear a lot of this year.
Inflation can be tricky to keep track of. It's got a lot of moving parts and unique circumstances. We'll leave the data digging and interpretation to the experts and focus on how to keep track of inflation at a high level so our portfolio returns don't erode.
Four Charts to Check for Inflation
The next scheduled Fed interest rate decision is on March 22. Till then, we'll get more economic data, which could change things if the data deviates widely from expectations, or the market could continue moving sideways until there's more certainty about inflation. To get a high-level view of inflation's impact on the stock markets, it's a good idea to set up your ChartLists or layouts that include a broad equity index such as the S&P 500 index, Treasury yields, the US dollar, and gold futures.
The S&P 500 Index
The S&P 500 index ($SPX) looks like it's hesitant to break above its 50% Fibonacci retracement level (from the January 4, 2022, high to the October 13, 2022 low). There's not much volatility, probably because traders and investors are waiting on the sidelines for some certainty. A break above the 50% retracement level could take the S&P 500 to its August high of around 4,300, but there's an equal chance the S&P 500 index could drop to around 4,000, or its 38.2% retracement level.
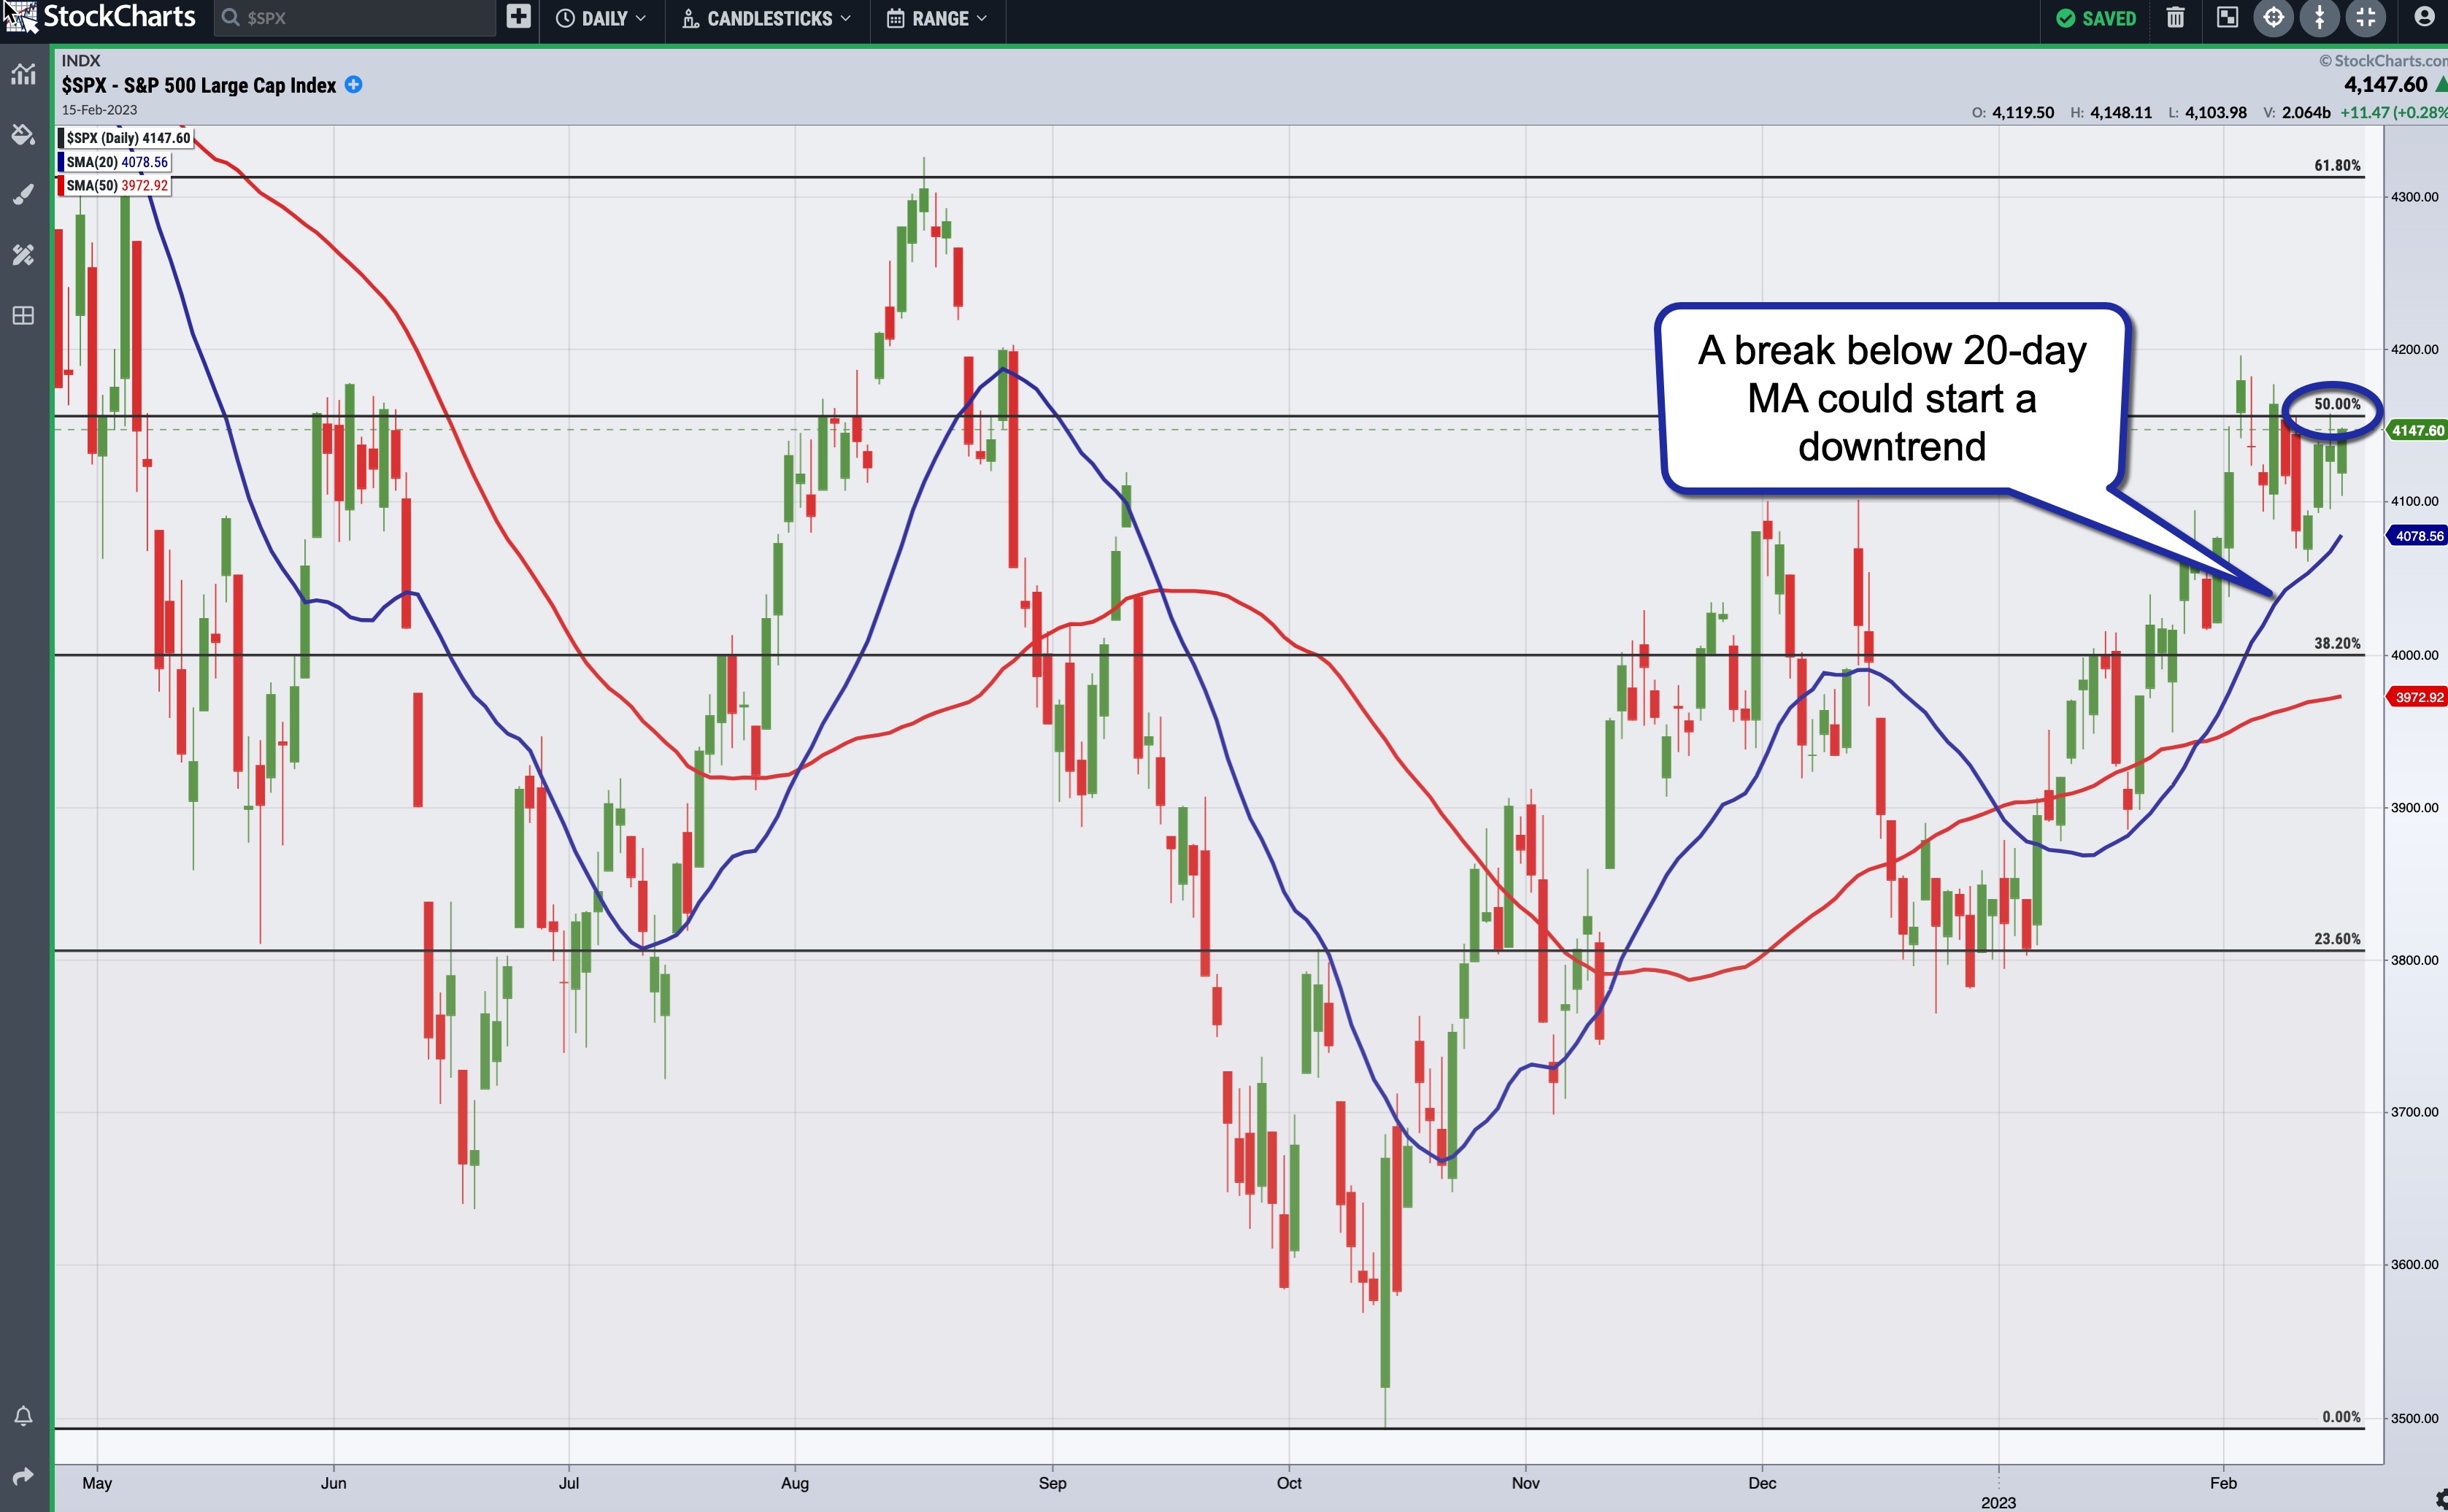
CHART 1: SUPPORT AND RESISTANCE LEVELS IN THE S&P 500 INDEX. A break above the 50% Fibonacci retracement level could take the S&P 500 index higher toward its August high.Chart source: StockChartsACP. For educational purposes only.
The 20-day simple moving average (SMA) is trending higher and is acting as a valid support level in the uptrend from mid-January. If the S&P 500 were to fall below its 20-day SMA, it could signal the start of a downtrend.
10-Year US Treasury Yield Index
Like stock prices, bond prices are impacted by inflation. After trending lower since October 21, 2022, the 10-year US Treasury Yield index ($TNX) broke the downward trendline on February 10, 2023.
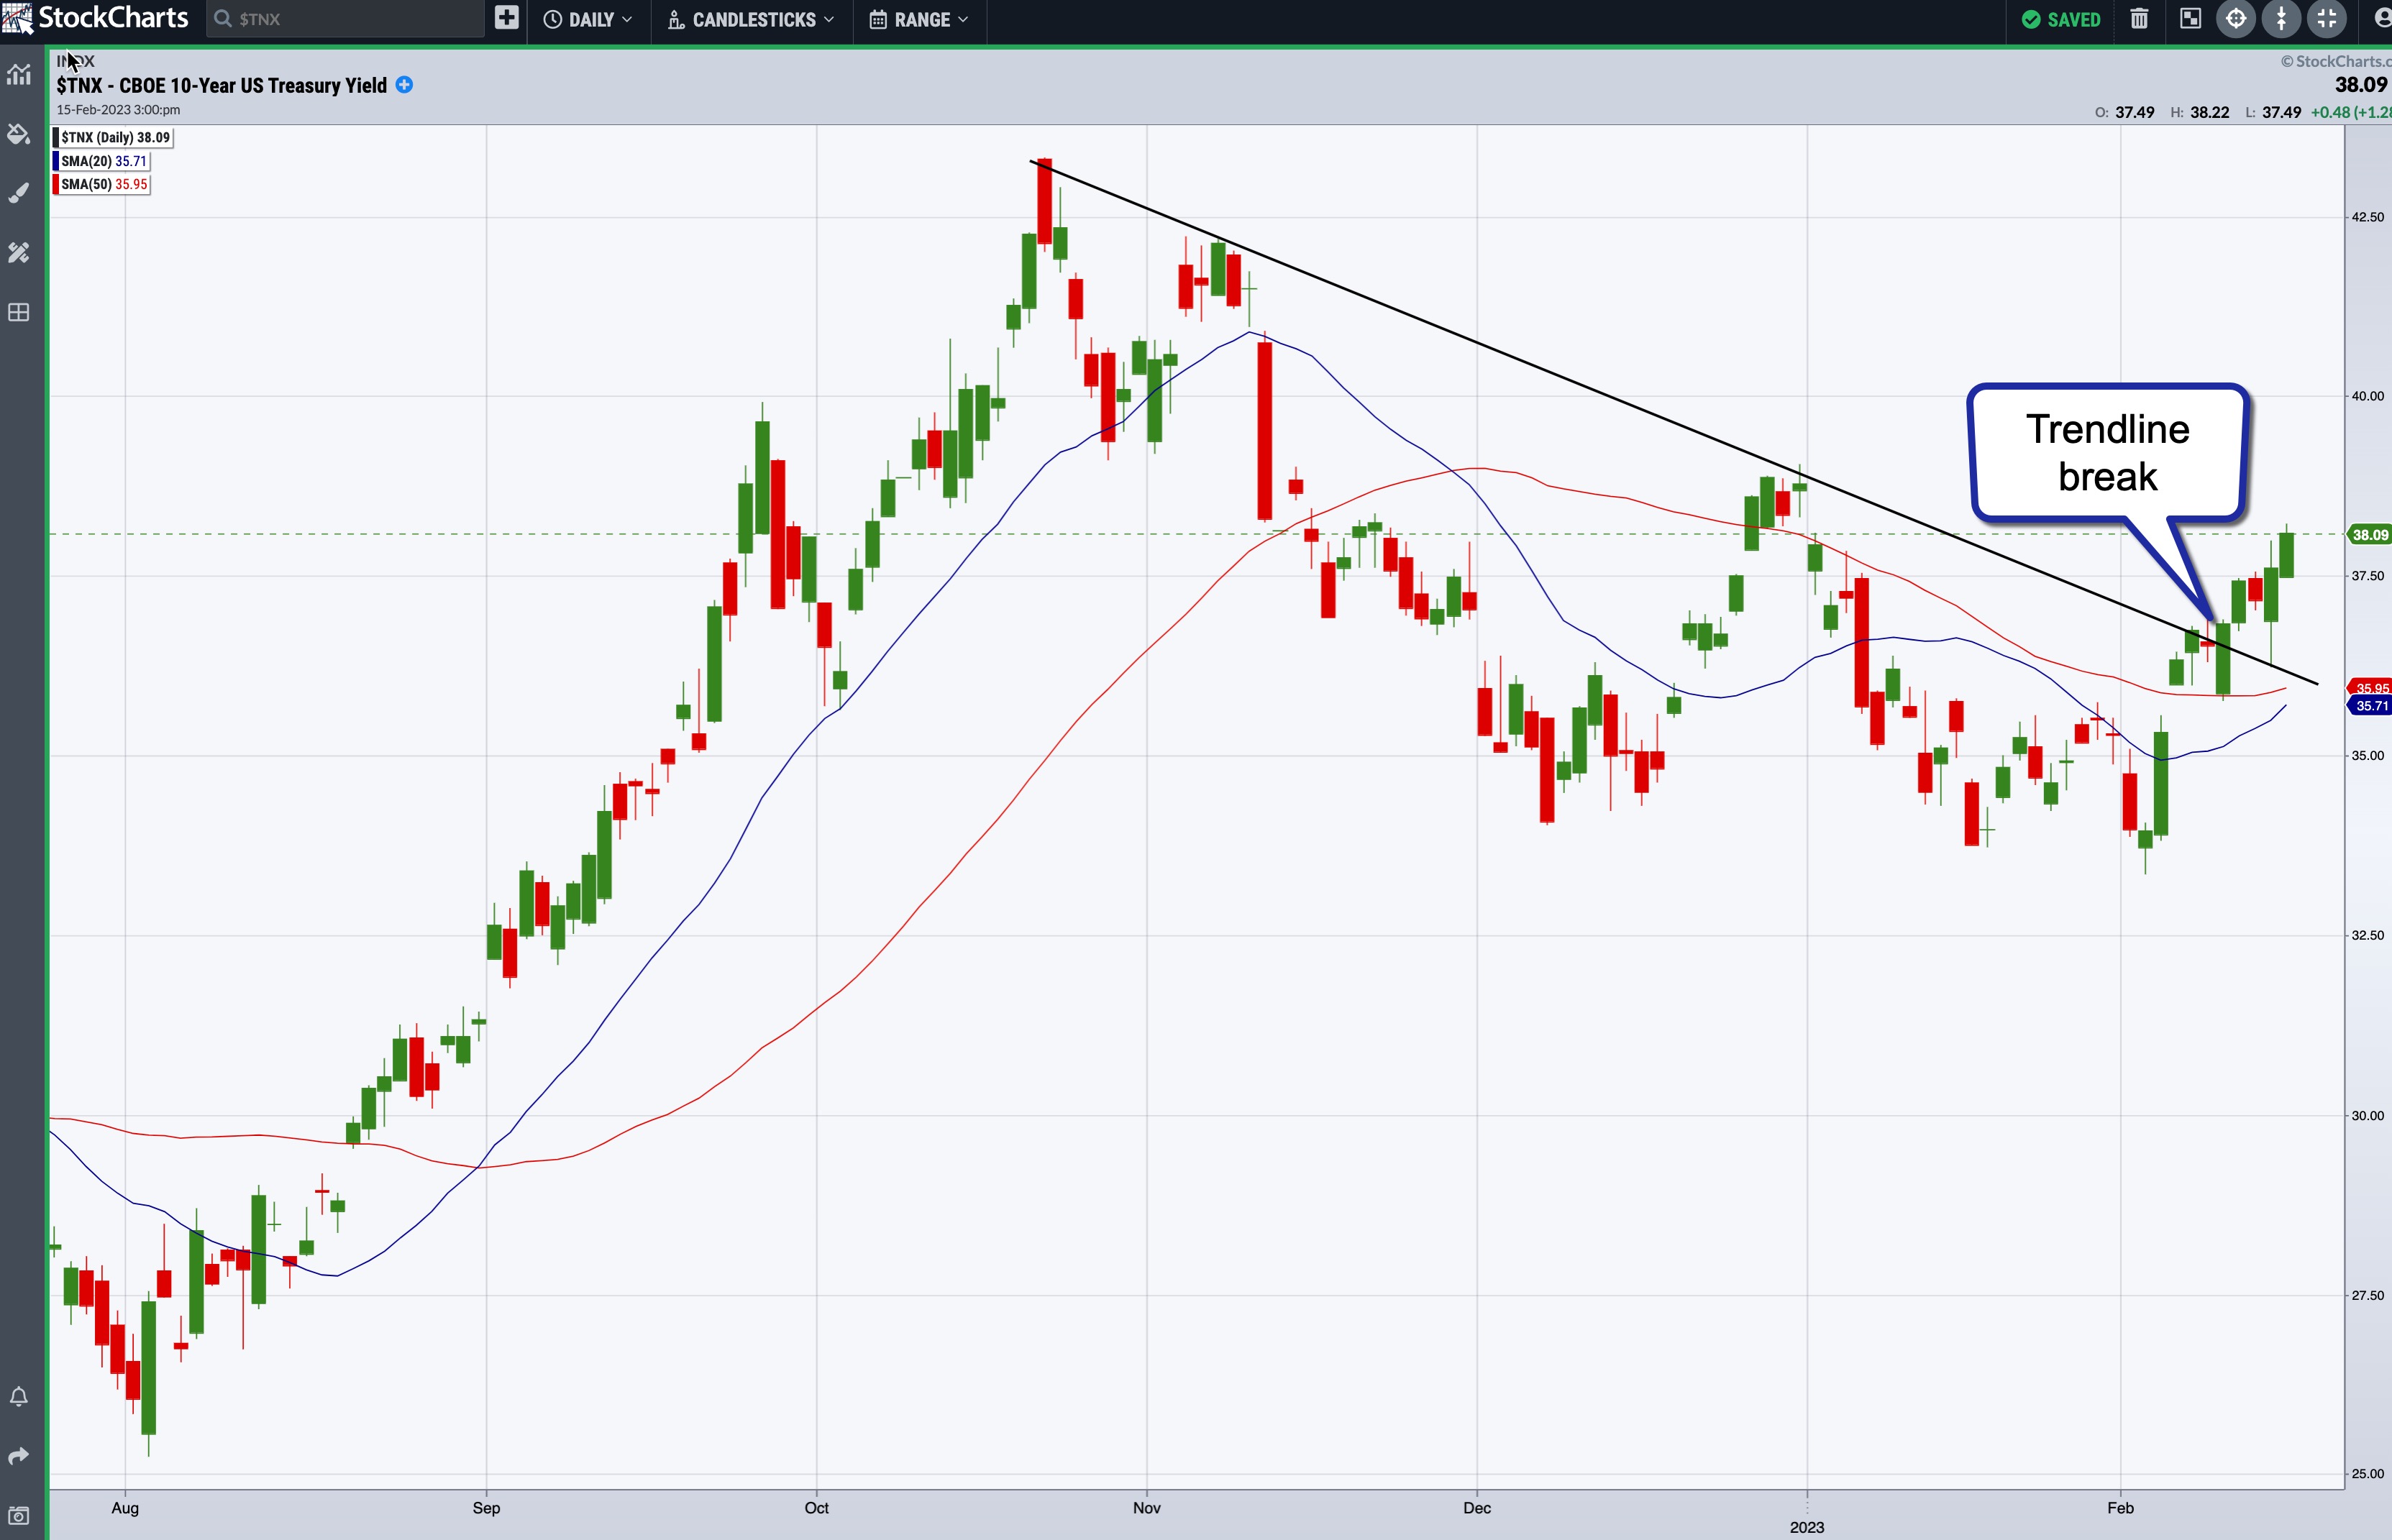
CHART 2: 10-YEAR TREASURY YIELD INDEX. The 10-year yields broke above a downward-sloping trendline and look to have started an uptrend, although that could change if there's certainty that interest rate rises will start tapering.Chart source: StockChartsACP. For educational purposes only.
Another point to note on the chart is that the 20-period moving average is getting close to crossing above the 50-day moving average. If the cross does take place, it could signal that yields may move higher. This could change in a snap if inflation numbers support a tapering or pivot in the future.
The US Dollar
After the January CPI release, the dollar spiked, but pulled back relatively quickly. The dollar has been in a trading range since February 6 and is in the middle of a flag formation. Although there's still time before the next Fed meeting, it's worth keeping an eye on the top and bottom of the flag.
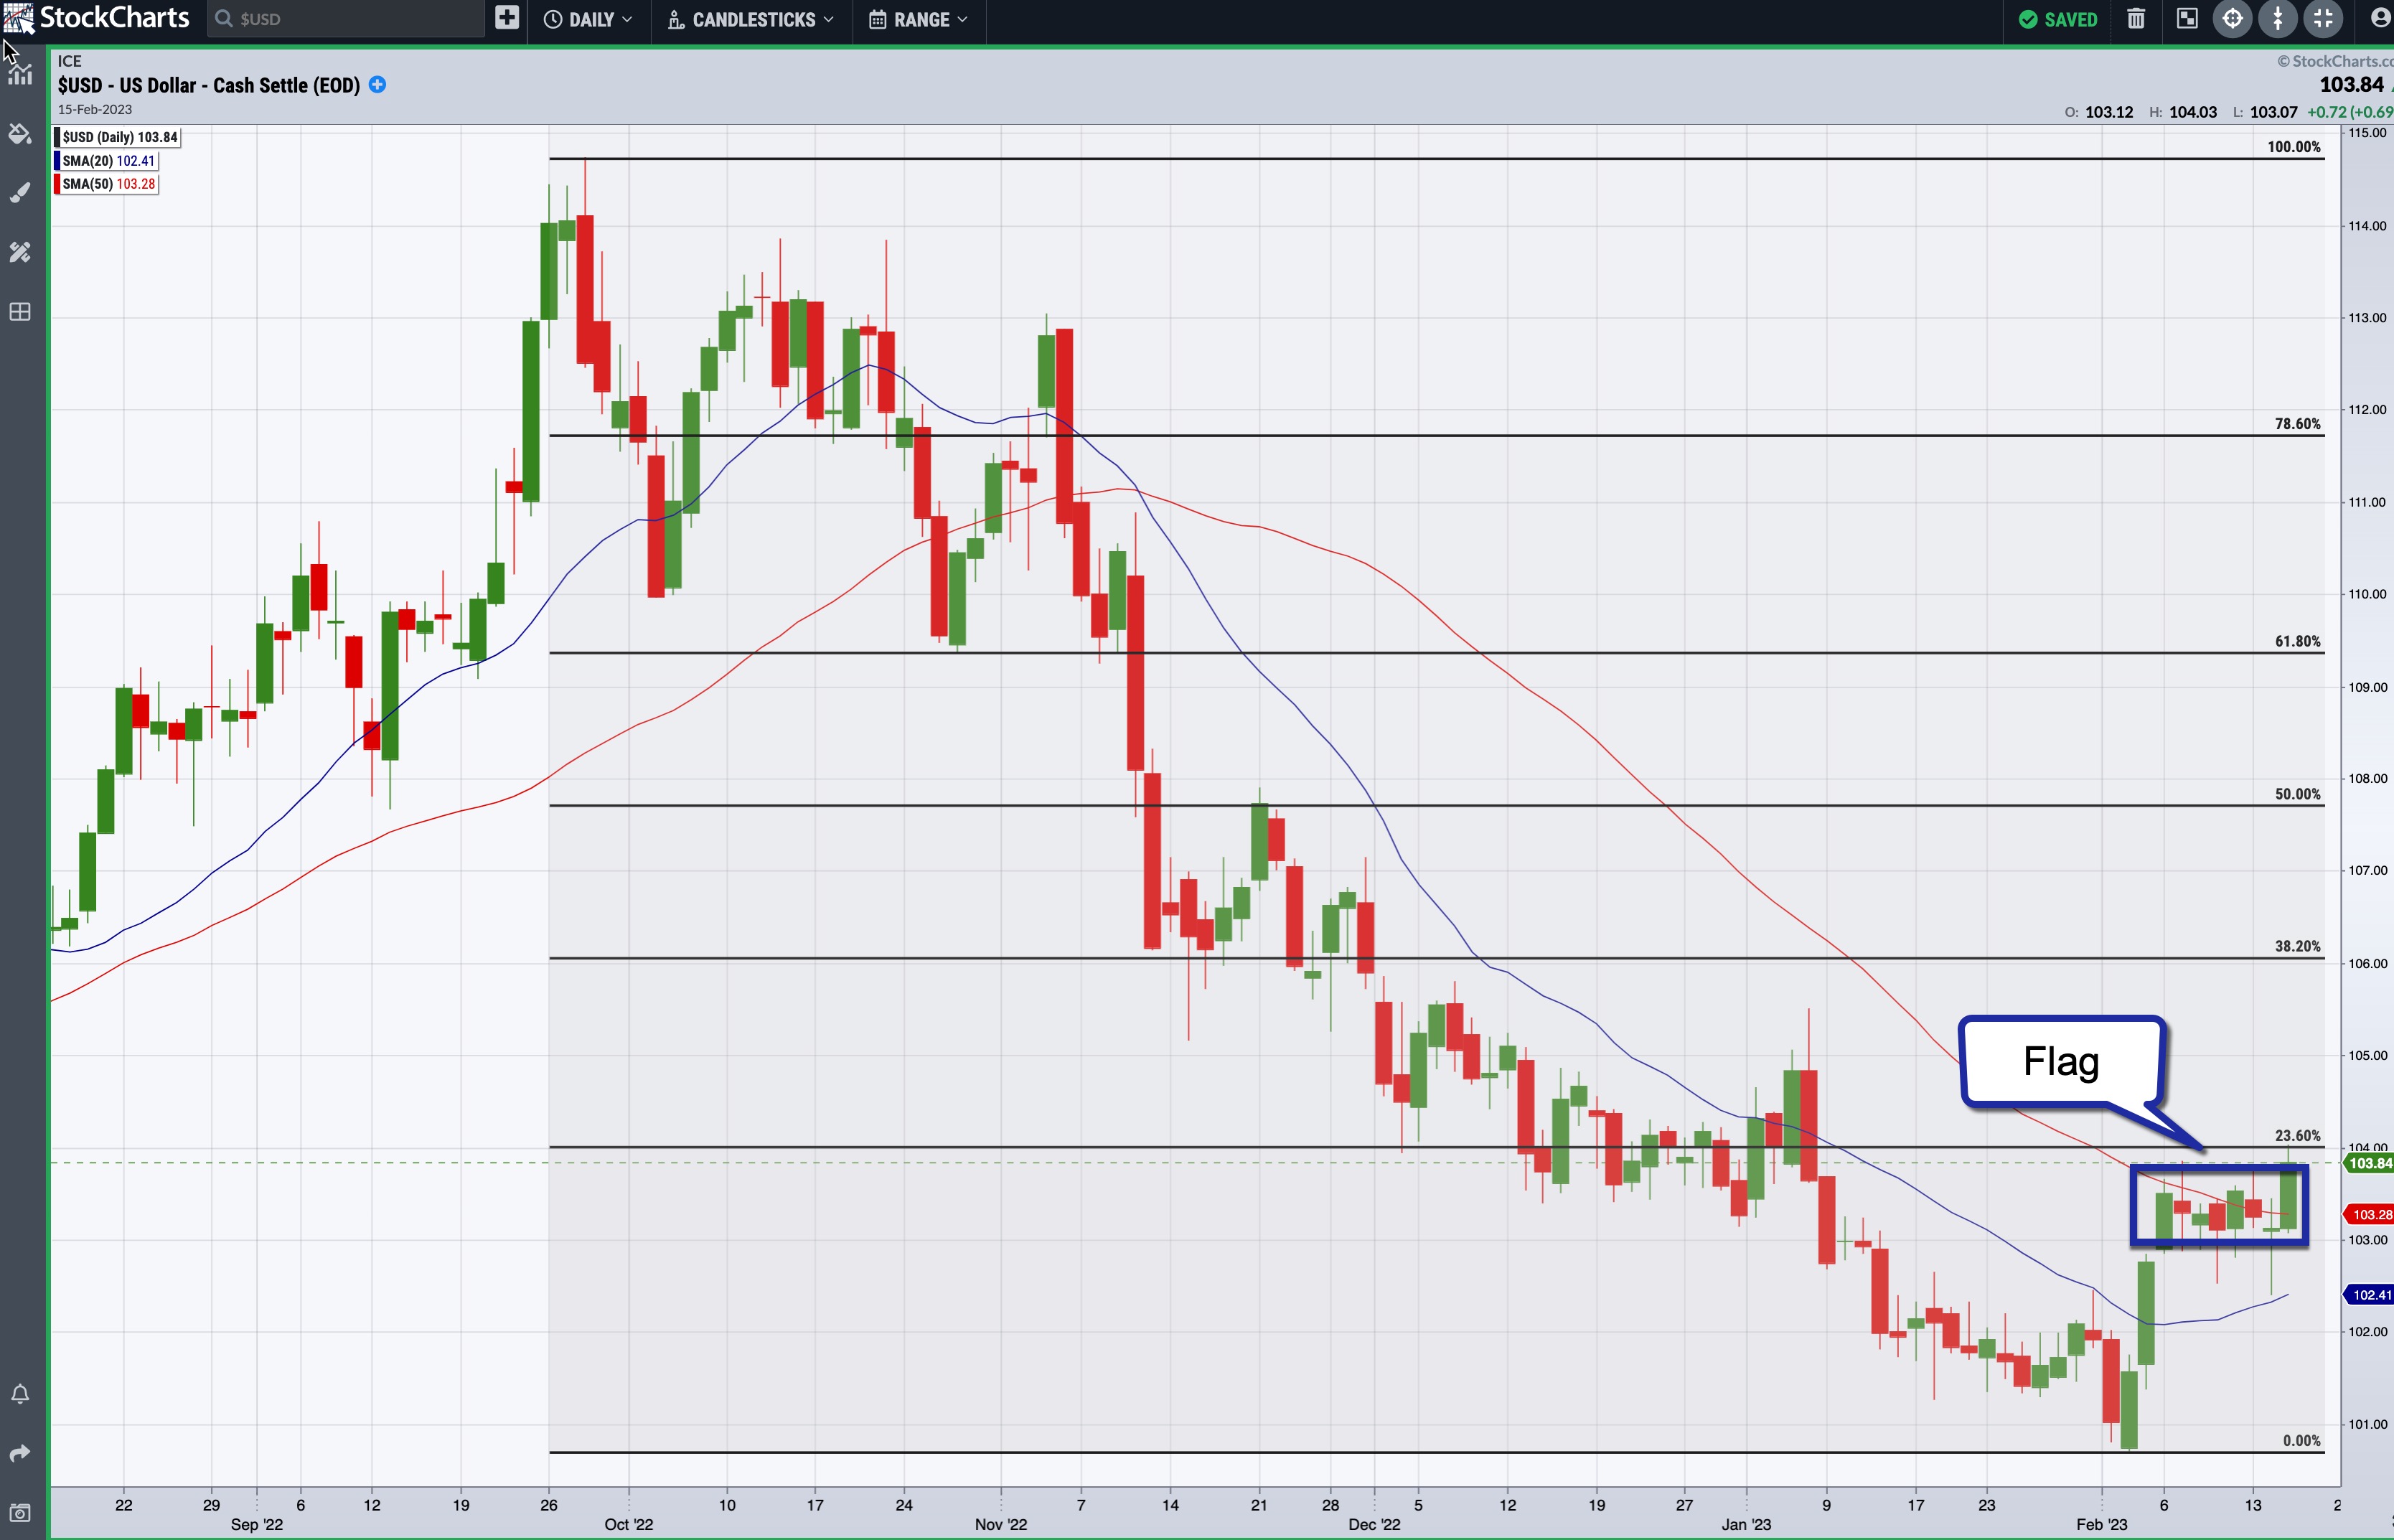
CHART 3: THE US DOLLAR. The dollar tends to be sensitive to inflation. A break above the flag formation could mean a rally in the dollar, but it could also go back down toward its February low.Chart source: StockChartsACP. For educational purposes only.
Using Fibonacci retracement levels from the September 28 high to the February 2 low shows that a break above the flag would take it to the 23.6% Fibonacci retracement level. That's not too far away from where the dollar is trading, so a break above the top of the flag could take the dollar to its next resistance level—the 38.2% level. And if it breaks below the flag, the US Dollar index could head back to its February low of 100.68.
Gold Futures
Gold is considered a risk-off asset. When stocks fall, investors often invest in risk-off assets, such as gold. In inflationary times, gold is considered a hedge.
After reaching a high in early February, gold prices have seen a steep fall. Gold is now between its 23.65 and 38.2% Fib retracement levels and has fallen below its 50-day SMA. This increases the probability of gold falling even further. If it breaks below its 38.2% Fib retracement level, look for it to go to its 50% retracement level. But if inflation becomes a concern again, gold could move back up toward its February high.
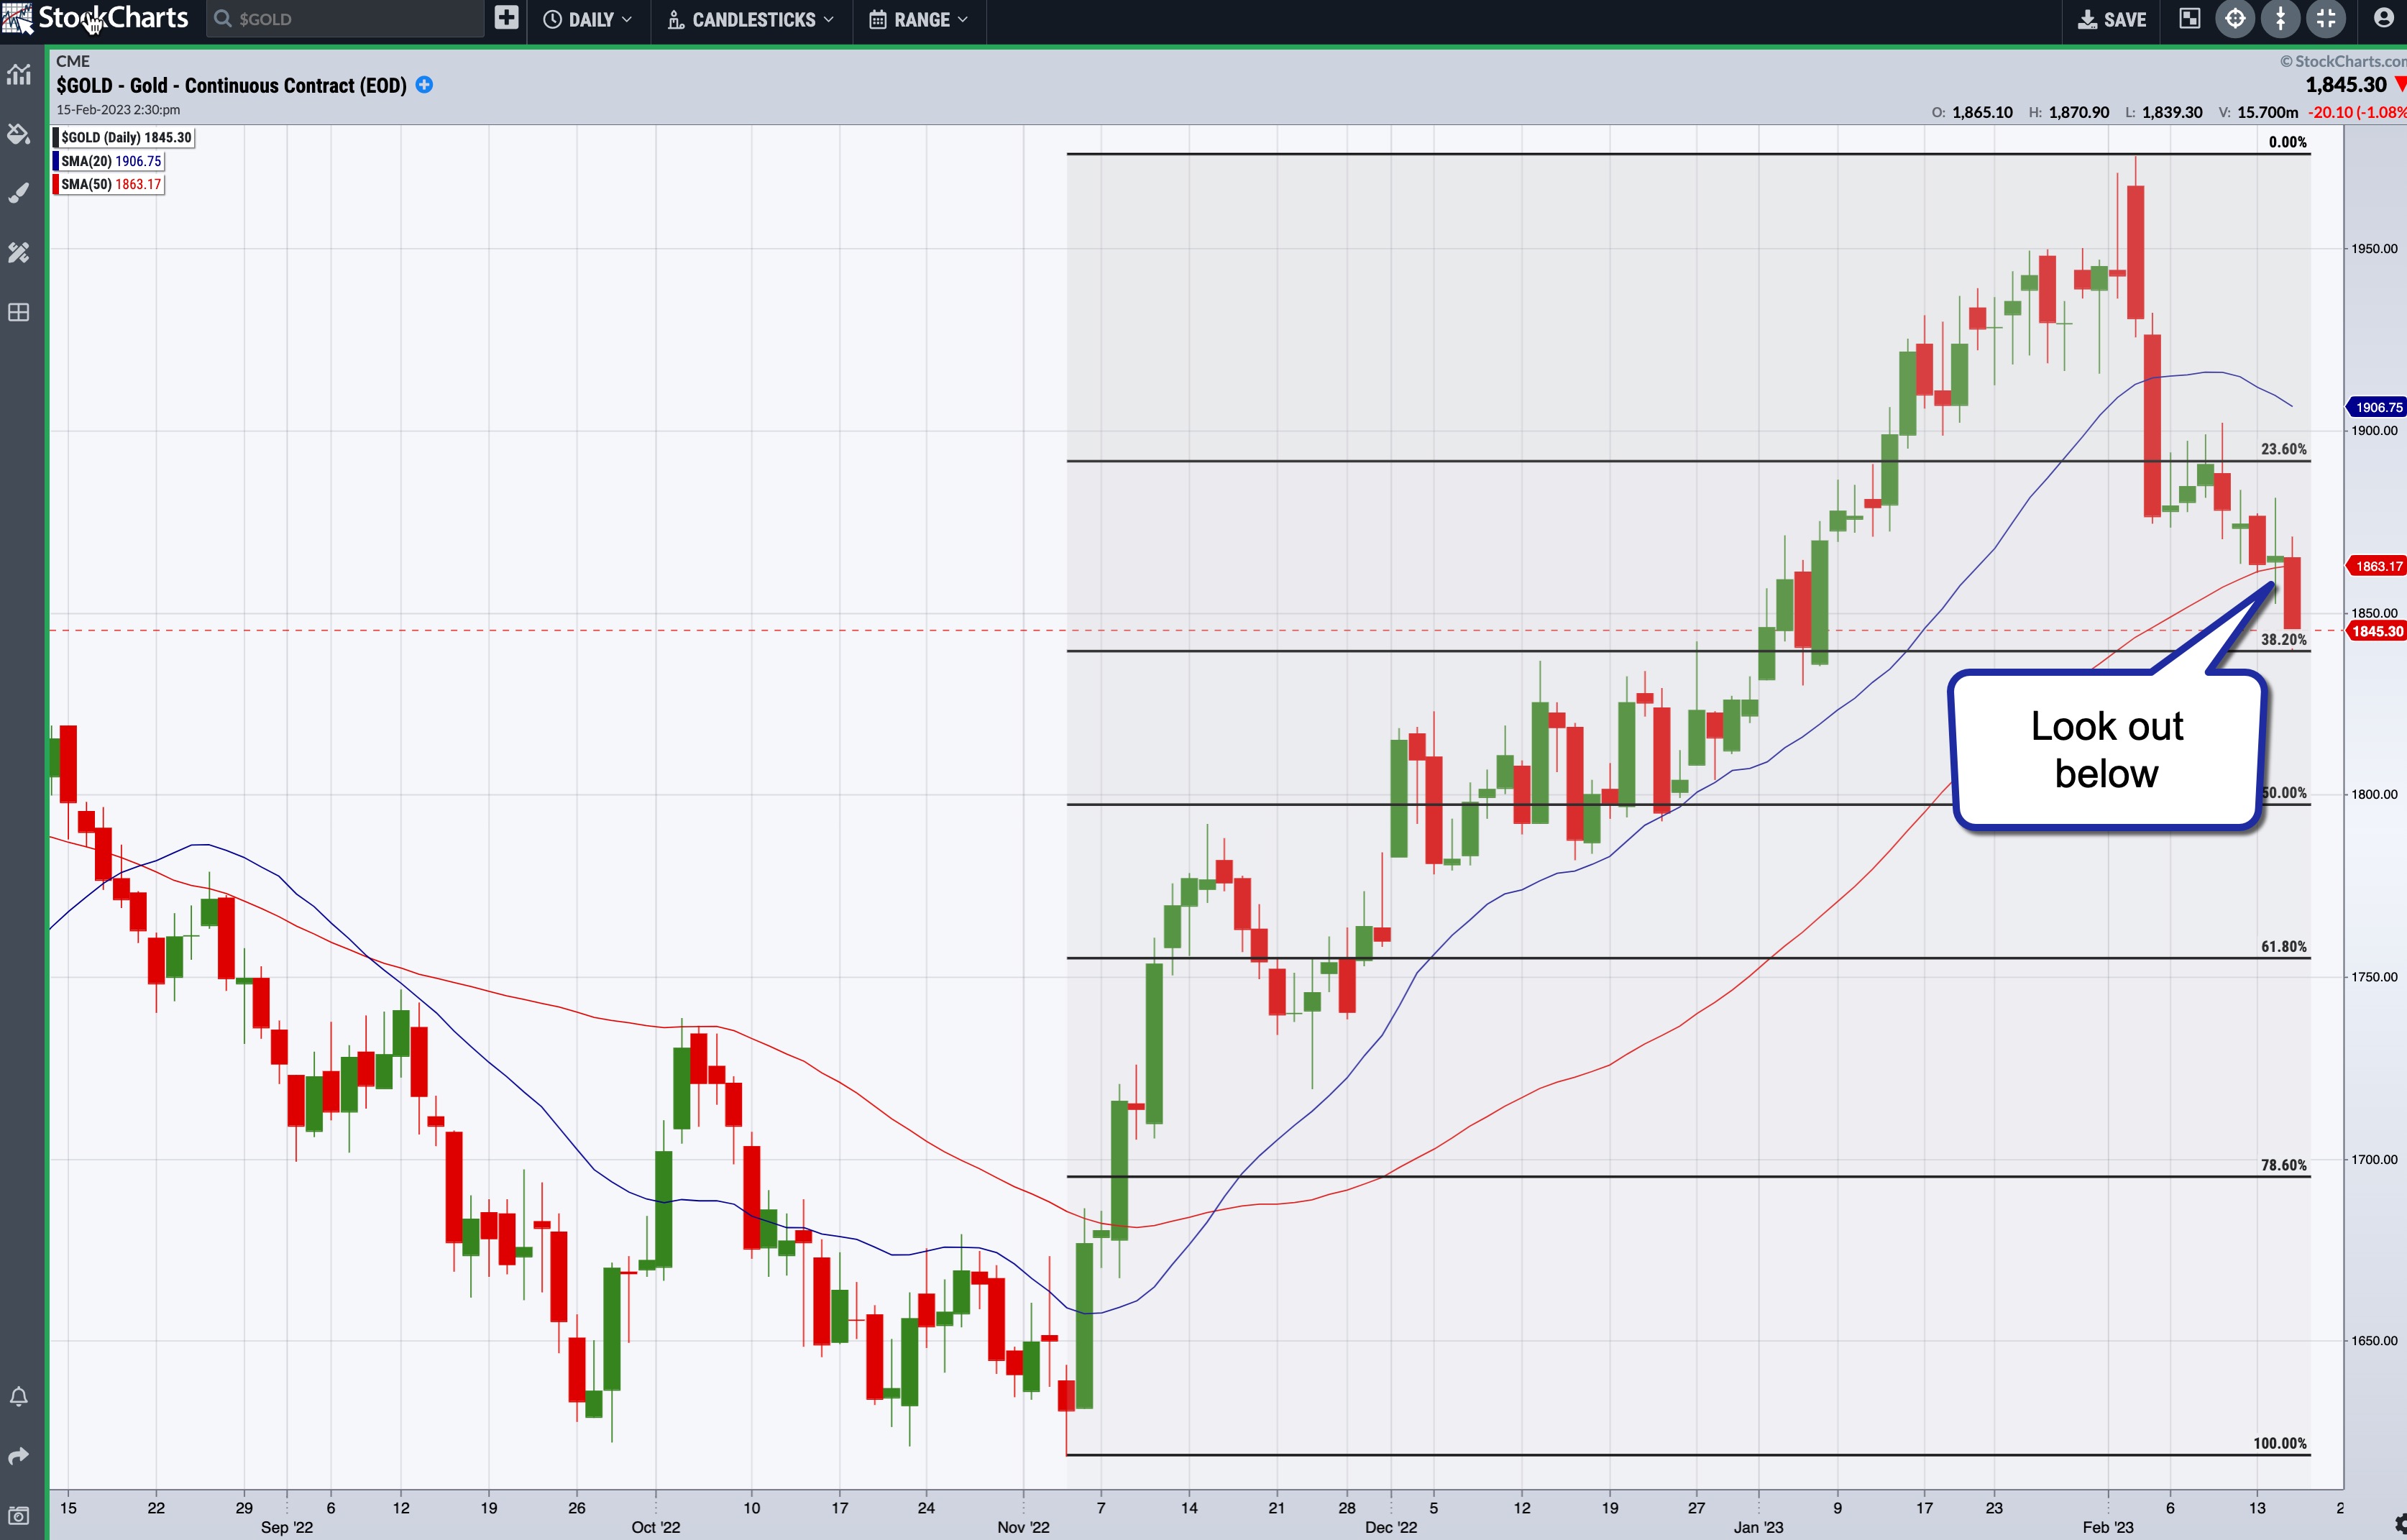 CHART 4: GOLD FUTURES BROKE BELOW 50-DAY MOVING AVERAGE. Gold prices could fall further if the inflation data support interest rate tapering.Chart source: StockChartsACP. For educational purposes only.
Mixed Messages?
The S&P 500 index and the US dollar are at a critical juncture. 10-year yields are trending higher, although that could change quickly when inflation concerns ease. Gold prices seem to be moving to the downside, which is an indication that investors aren't rushing to risk-off assets.
The next piece of data to focus on is the January producer price index (PPI) data, and keeping these charts—S&P 500, 10-year yields, US dollar, and gold—on your radar will keep you in tune with the market's reaction to inflation data.
If you're a StockChartsACP user, have four charts displayed on one screen using the layout feature. On SharpCharts, save these charts in a ChartList and view them in any format that you prefer.
Disclaimer: This blog is for educational purposes only and should not be construed as financial advice. The ideas and strategies should never be used without first assessing your personal and financial situation, or without consulting a financial professional.
Happy charting!


