
April is Financial Literacy Month—a good excuse to bump up your financial knowledge so you can be better equipped to manage your personal finances. To support your financial journey, StockCharts is featuring several articles in April that focus on how you can take advantage of the educational tools that can make you a smarter trader and investor.
With such a large universe of stocks, exchange-traded funds (ETFs), mutual funds, and so on to choose from, it can be tempting to base your decisions on a tip you received from a friend. But that doesn't necessarily end up well.
A better plan would be turning to techniques that have worked. Jesse Livermore, thought of as one of the greatest traders who ever lived, uses a three-pronged approach—timing, money management, and emotional control. Very basic, yet logical. It's one that any trader can apply when it comes to finding which stocks to trade.
Assume you've done your market analysis and, based on the action of the broader indexes, you've determined that large-cap stocks are performing well and are likely to trend higher. You want to get in on the action, but which stocks or funds should you trade?
Scanning the Stock Universe
Your objective is to make money on your investments. But how are you going to achieve it?
The key is identifying the setups that have a high probability of moving in a specific direction. You want your investments to have enough of a move that you can profit from. Unfortunately, traders often get caught up in making that money quickly. With such a mindset, it can be easy to make bad judgments. And the market is good at telling you when you made a bad judgment.
Wouldn't it be great if you knew you were wrong before the market told you? After all, you don't want to tie up your money in an investment that doesn't move much or one that loses money.
A prerequisite to trading or investing is to understand the market and yourself. In this age of information overload, it may be best to shut out everything you've heard and focus on looking at price charts. Go through charts of stocks that have had a long-term move in one direction and then reversed. Make a note of the different support and resistance levels. Analyze the price action at these levels. Did price make an explosive move for a few days, then pause and reverse?
Once you understand price action, the first step is to think about what types of stocks are likely to give you the most bang for your buck. Do you want to find:
- stocks and funds that have reached their 52-week high,
- stocks and funds that are reversing from a downtrend, or
- stocks and funds that are crossing above a SCTR of 80?
Let's say you're looking for stocks that are in a new uptrend because, well, you want to take advantage of the developing trend. From looking at your charts, you've identified that, once a stock starts to trend higher, it moves pretty quickly for a few days, then slows down and pulls back. After the pullback, it continues to move higher.
You want to get in on this trend, but the key is to get in at the right time.
Scans To Identify the Best Stocks
Once you've formulated the price behavior of a particular stock, you can run some scans. The good news is that StockCharts has predefined scans that mimic some of the more common price actions of stocks. There are a few different ones for identifying stocks that are in a new uptrend.
How To Find Predefined Scans in StockCharts
- From Your Dashboard, under Member Tools, select Advanced Scan Workbench.
- Select Predefined Scans and look through the large collection of scans.
- Try out a few of the scans. Scans are sorted based on equities and mutual funds. Equities are sorted by the exchanges they trade in and include US, Canadian, UK, Indian exchanges.
- Edit the scan criteria so it does what you want it to do.
- Save the scan to a ChartList or download the .csv file.
Say you used the Stocks in a New Uptrend (Aroon) predefined scan to start your scan. You'll see that the results are sorted by the exchanges, and there's a column for mutual funds. So, in the image below, you see 27 NYSE stocks made the list. Click on it to bring up a list of all those stocks. You could sort the list by any of the columns. For example, if you're looking for those with the highest SCTR score, click on the column heading to sort in ascending or descending order. If you want to sort by the universe, you can click on the U column and sort.
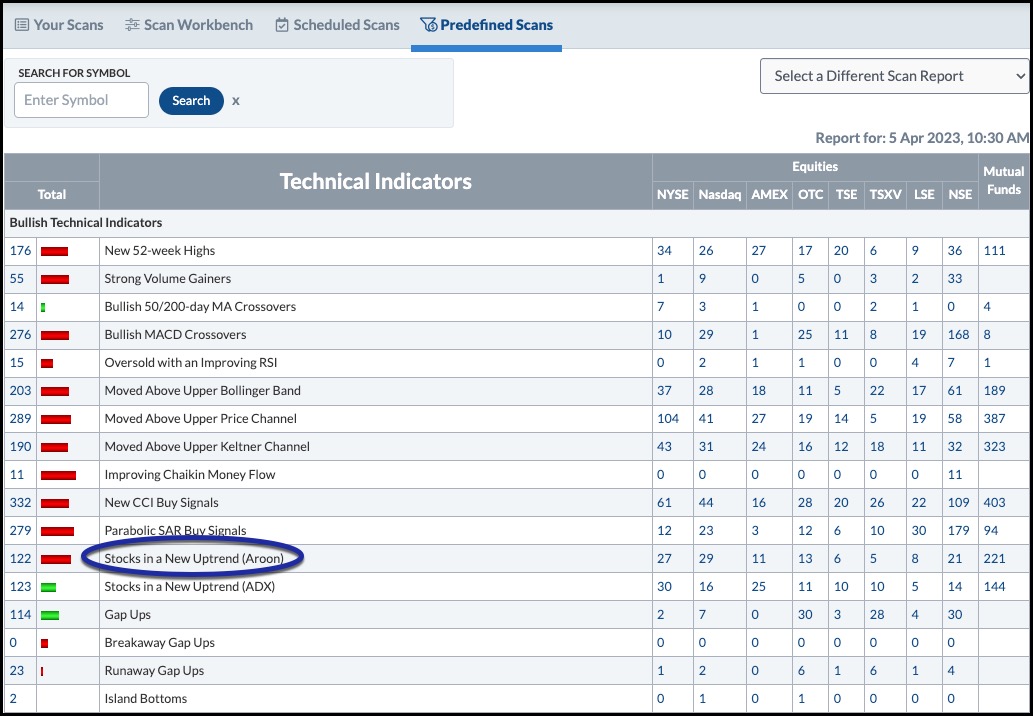
CHART 1: PREDEFINED SCANS. To look for the best stocks to trade, review the predefined scans in the StockCharts platform. It's easy to modify the scans so it meets specific criteria.Chart source: StockCharts.com. For educational purposes only.From your earlier analysis, you see that large-cap stocks are outperforming. Based on that, you want to identify large-cap stocks that are in a new upward trend. After sorting by universe, you identify a handful of large-cap stocks. Hover your mouse over the stock symbol to see a small chart. It's one way to quickly run through the charts to see if they're close to their highs or lows or if the price is more in line with your risk tolerance level. Running through the list will help to narrow down your stocks even further.
Zeroing in on a Stock
Say Pfizer, Inc. (PFE) was one stock that you shortlisted. Pull up a chart of the stock to do your analysis. The Aroon Up is at 100, and Aroon Down is at 28, which means the strength is to the upside. But will the uptrend sustain? To answer this question, you could perform a more in-depth analysis.

CHART 2: STOCK IN A NEW UPTREND. The Aroon indicator helps identify stocks that are in a new uptrend. Pfizer (PFE) was one of the stocks in the scan results. Doing a more in-depth analysis of the stocks helps to identify entry and exit points.Chart source: StockChartsACP. For educational purposes only.
The Aroon indicator helps identify emerging trends. The Aroon-Up has moved above the Aroon-Down, with Aroon-Up well above and Aroon-Down well below 50. The third stage is when Aroon-Up reaches 100 while the Aroon-Down is relatively low. So, in the case of Pfizer, the emerging trend reached all three stages pretty quickly. The Aroon Oscillator in the lower sub-chart shows the difference between the two.
If you look back at the last uptrend, from October to December, the crossover occured closer to the 50 level, whereas this time, it was lower—closer to the 30 level. The stock price had some big moves during the uptrend, then slowed down a bit. In the most recent uptrend, volume increased on March 31 and April 3. The down day on April 4 had a slightly lower volume.
If the uptrend continues with strong moves with high volume, it could be a potential candidate for a long position. But the stock is trading a hair below its 50-day moving average (MA), so, if you were considering trading Pfizer, you may want to set an alert for when the stock price crosses above the 50-day MA, then observe it. If the stock slows down, pulls back, and then continues its uptrend, there's a strong chance you could make a decent profit.
Stay in Tune With Stock Price Movement
It's important to understand how a stock moves to time your exits. It requires patience, but it can be worth the wait. Once you decide to enter a long position in the stock, watch how price moves. In particular, look at the momentum in the up moves vs. the down moves.
Once you sense a slowing down, you may want to exit your positions. Looking at the chart, the stock tends to fall hard and fast. You don't want to get caught up in that downfall, so you can't let your emotions control you. Your winning trade could turn into a losing trade, and you could end up hanging on to a losing investment for way too long. You know yourself better than anyone else. Risk only what you feel comfortable losing in the trade.
You can apply this type of analysis to different stocks before deciding which stock to trade. Stay tuned for more articles during Financial Literacy Awareness month that focus on helping you become a more empowered trader and investor.

Disclaimer: This blog is for educational purposes only and should not be construed as financial advice. The ideas and strategies should never be used without first assessing your own personal and financial situation, or without consulting a financial professional.
Happy charting!


