
Getting a jump on a sector rotation is like accelerating into a blind curve. What could go wrong? Well, your timing may be way too early. Your sector selection of sectors may be off. You may be pre-empting a false signal. And so on.
The good news is that some standard models can make it easier, and their movements are easy to track.
The Shift from Cyclical to Defensive
Monitoring shifts from risk-on to risk-off assets is one way to gauge the overall sentiment on the economy. One of the most basic ways to watch this shift is to see rotations between cyclical and defensive sectors. As contributor Mish Schneider writes, always pay attention When Uncle Utilities Shows Up Drunk to the party.
Defensive sectors comprise Healthcare (XLV), Consumer Staples (XLP), and Utilities (XLU).
Cyclical sectors comprise Consumer Discretionary (XLY), Materials (XLB), Financials (XLF), and Real Estate (XLRE).
How's the Party Going So Far?
The ADP report gave us some mixed signals. Mining, construction, transportation, and hospitality jobs ticked up (Materials, Industrials, and Consumer Discretionary sectors), but so did utilities and healthcare jobs. Financials, tech, and various professional services, however, are down. Overall private-sector employment grew year-over-year at a slower rate than expected.
Meanwhile, job openings, according to the JOLTS report, reached their lowest levels since May 2021. And today's jobless claims report revealed that 228,000 jobs were lost the previous week. Overall, layoffs are on the rise, and the Tech sector is leading the pack. All of this indicates that perhaps the US economy may be ailing and that April may give us a few cruel surprises.
All of this is a prelude to the big March jobs report (Employment Situation), and we'll see if it, in addition to all the reports leading up to it, gives investors further motivation to turn the toggle from risk-on to risk-off.
Mapping Defensive and Cyclical Movements
There is little you can glean from looking at the sector proxies (the ETFs) individually or side by side. This is where a comparative sector map—like the Relative Rotation Graphs (RRG)—comes in handy. It traces the cyclical movement of relative strength and momentum relative to the S&P 500. Here's a brief YouTube explainer.
This is what the defensive and cyclical scenario looks like right now.
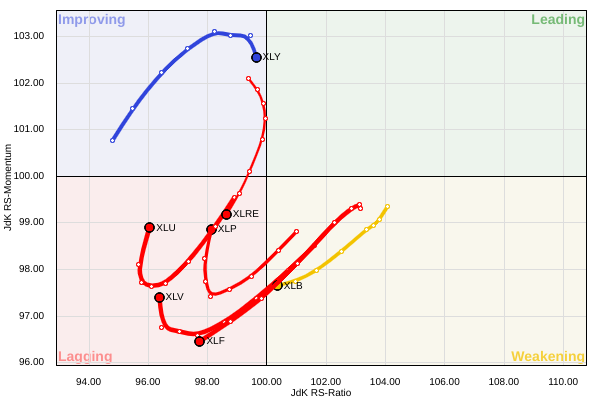
CHART 1: RELATIVE ROTATION GRAPH OF DEFENSIVE VS. CYCLICAL. Healthcare, Consumer Staples, and Utilities, which are defensive sectors, are turning up toward the "improving" quadrant.Chart source: StockCharts.com. For educational purposes only.
- The graph above looks at weekly performance, and each node represents a week.
- The current node represents the current week (or the "week of," which, as of this writing, still has a day for completion).
- While XLY (discretionary) is turning downward from the "improving" quadrant, you can see XLB. XLF, and XLRE entering the "lagging" quadrant.
- Meanwhile, all three defensive sectors are deep within the lagging area but turning up toward the "improving" quadrant.
In short, if this particular rotation takes place, then you're early in the game.
So, how does each defensive sector look comparatively? It may help to take a brief look at PerfCharts.
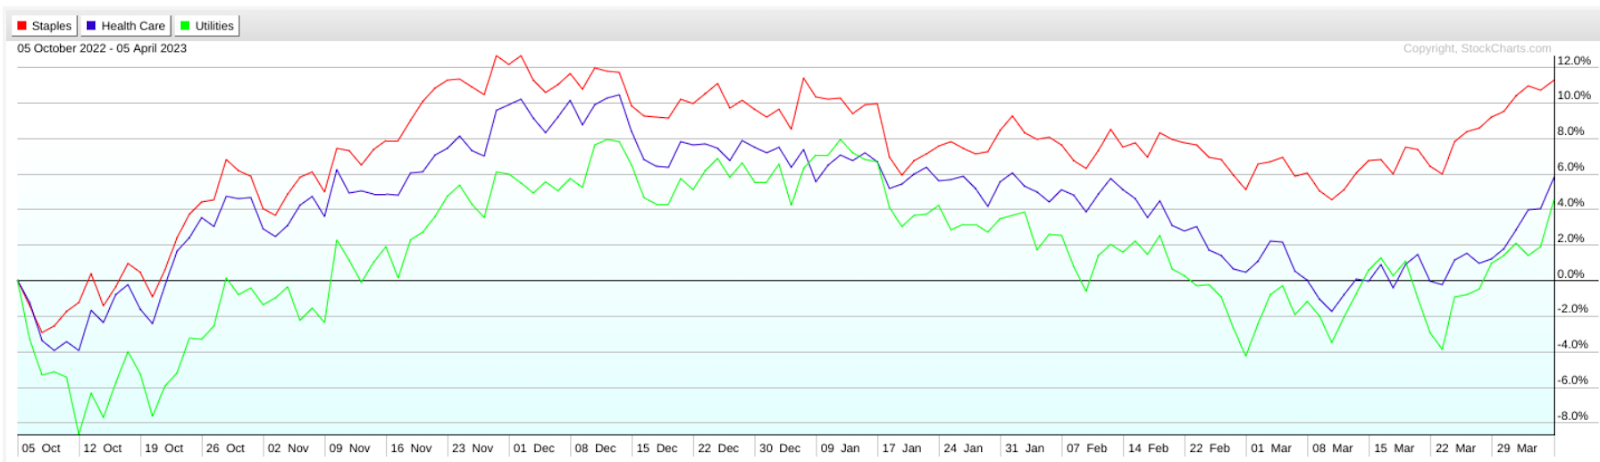
CHART 2: COMPARING CONSUMER STAPLES, HEALTHCARE, AND UTILITIES.
Consumer Staples is the clear outperformer, with Healthcare and Utilities following behind. But if you wanted to take an aggressive entry into one of these sectors, would this information alone be sufficient? It depends on your strategy and timeframe. You might want to check each sector individually.
Looking at Each Sector Proxy Individually
It may help to briefly power through each reading to get a gist of what's going on.
Consumer Staples (XLP)
As shown in the PerfCharts above, XLP, if viewed using an Ichimoku Cloud chart, still looks like the most promising.
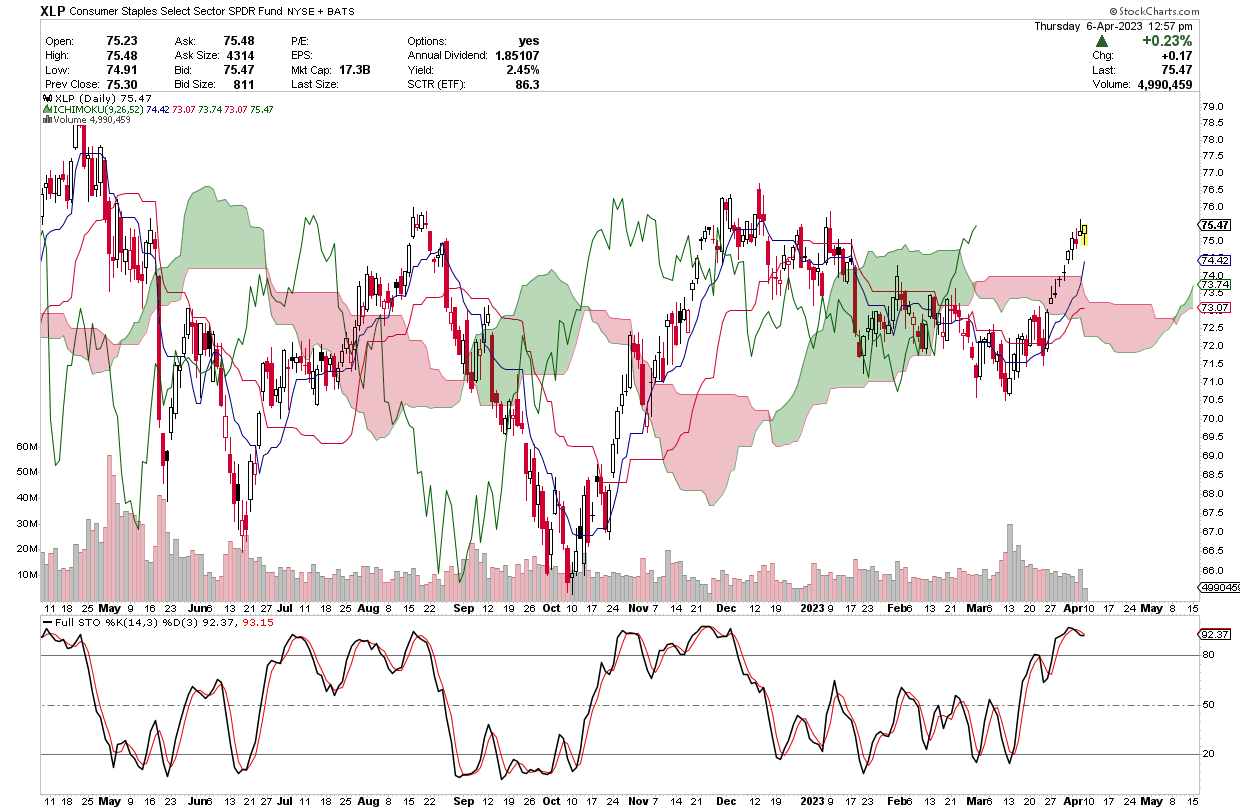
- Pay attention to the Lagging Span 26 days back and notice that it had crossed above the cloud, past prices, conversion line, and baseline. Among the three, XLP indicates the strongest amount of buying pressure from a technical standpoint.
- Note the Stochastic Oscillator reading is in "overbought" territory.
- And to that, notice the cloud shifting from red to green, laying out a potential support range 26 bars ahead of current prices.
Healthcare (XLV)
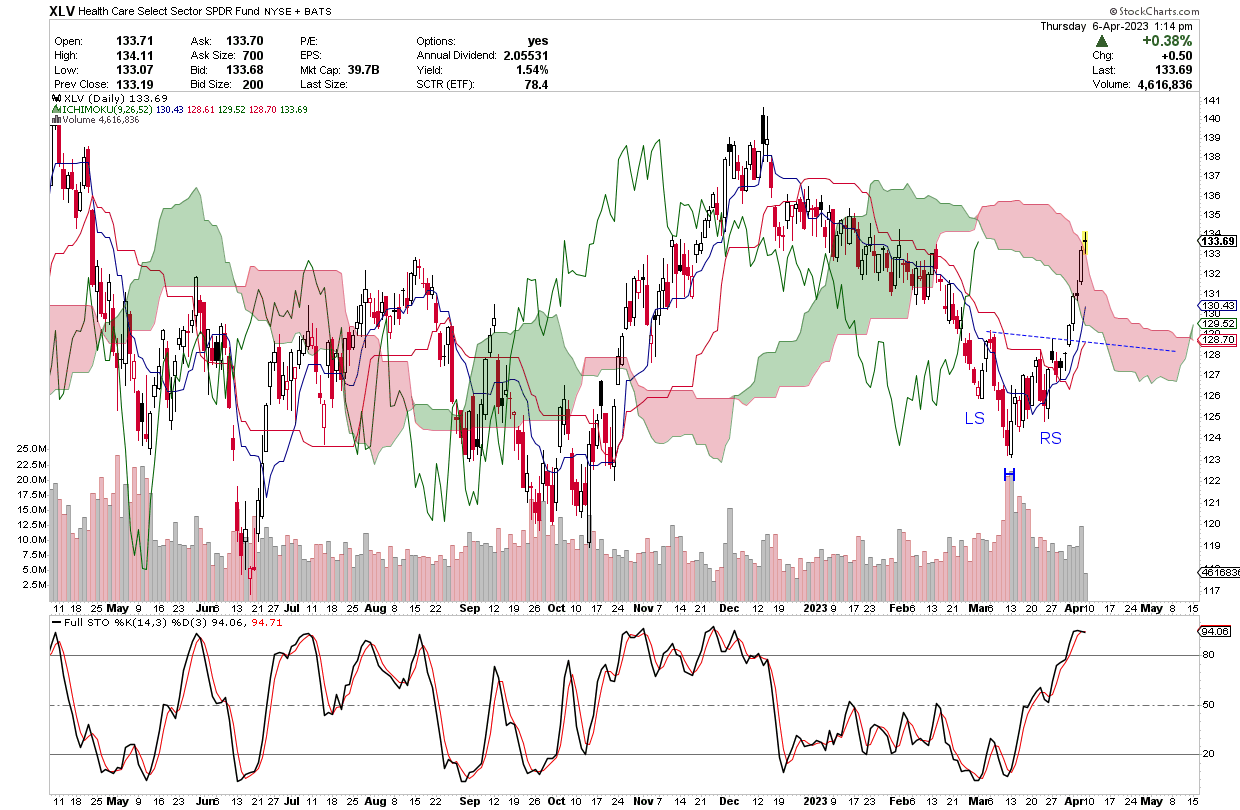
XLV is the second runner-up trailing behind XLP in the PerfCharts scan.
- Though similar to XLP, it's hard to tell whether price is about to buck the trend (as you see a slight conversion of cloud color from red to green 26 days ahead), or whether price is about to reverse into the cloud-as-resistance range.
- The cloud and lagging span positions don't give as convincing a reading as in XLP.
- However, notice the Head & Shoulders Bottom pattern. Can you expect a pullback to the downward-sloping neckline?
- According to Thomas Bulkowski's stats, this pattern has an average rise of 45%, a throwback rate of 65%, and a percentage of meeting its price target by 71%.
- Fundamentally speaking, it might be the former, which would strengthen the bias toward a rotation from cyclical to defensive.
Utilities (XLU)
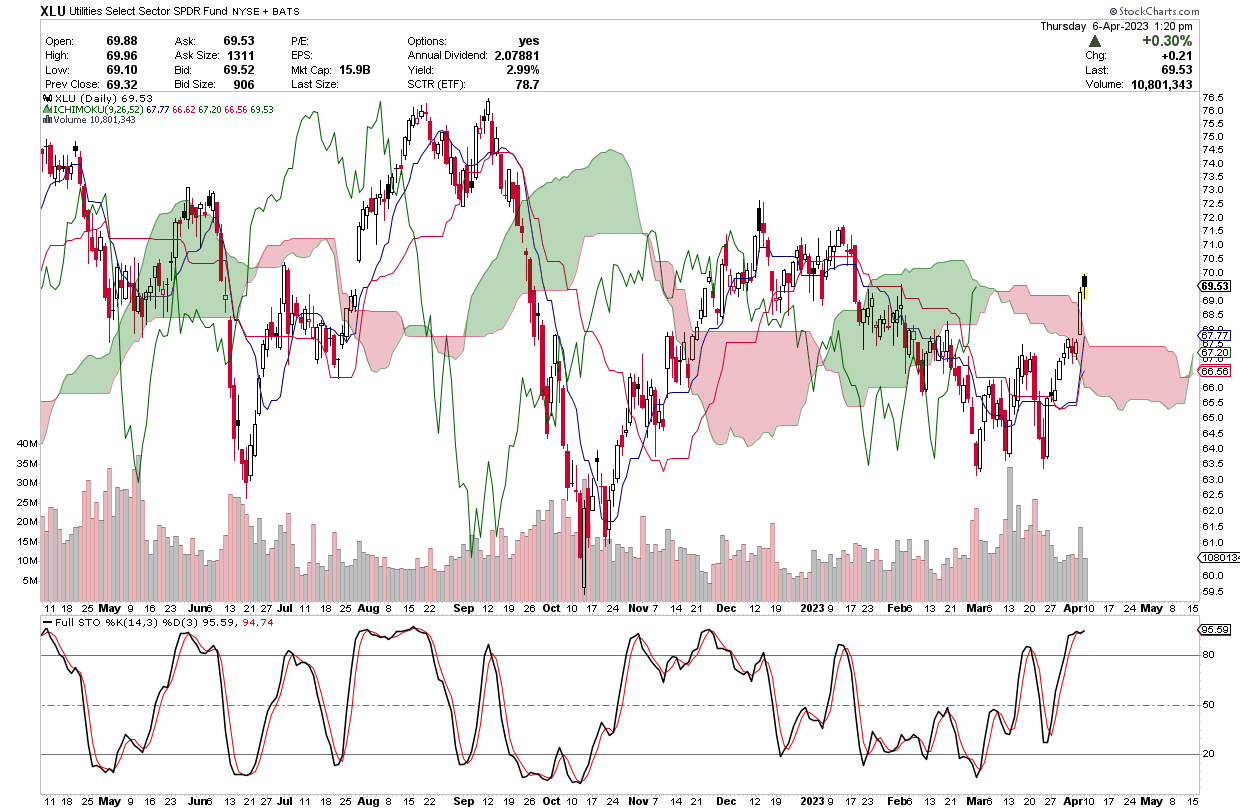
Mish's "Uncle Utilities" (XLU), the laggard in this rotational shift, looks the closest to XLP with regard to potentially bucking the trend.
- The cloud is shifting from resistance to potential support.
- If the lagging span crosses above the cloud, it will mirror current prices finding support at or near the cloud and would probably take place 26 periods ahead of the current period.
The Bottom Line
Keeping a keen eye on sector rotation can provide valuable insights into potential market shifts and help investors stay ahead of the curve. As the economic outlook remains uncertain, monitoring the likelihood of a sector rotation from cyclical to defensive sectors becomes crucial. The various fundamental and technical indicators mentioned in this article serve as useful tools to assess this potential shift.
By closely observing these metrics, traders and investors can better anticipate and respond to any emerging trends, possibly leading to a rotation from cyclical to defensive sectors if it indeed occurs. Staying informed and adaptable in the ever-changing financial market landscape is key to successful market engagement.

Disclaimer: This blog is for educational purposes only and should not be construed as financial advice. The ideas and strategies should never be used without first assessing your own personal and financial situation, or without consulting a financial professional.
Happy charting!


