
Bitcoin bears currently hold a slight edge in the ongoing technical tug-of-war for prices. The 'OG' crypto is about to break below a two-month support level, leaving BTC bulls scouring the next series of local lows either to scoop up more of the crypto or to exit an increasingly toxic position.
Whatever's going down, the technical environment seems a bit precarious from the heights of a 61% year-to-date performance. In a scenario like this one, some traders might start seeking the fundamental picture. But here's the kicker: does such a thing exist for this ghost-town currency?
According to several lawmakers belonging to the UK Treasury Select Committee, maybe we're looking at it the wrong way: in short, they're sure these are "gambling" assets and not "financial" assets. Might they be right? It's too early to tell.
Technically Speaking
Bitcoin's technical headwinds are clear and numerous (see chart 1).
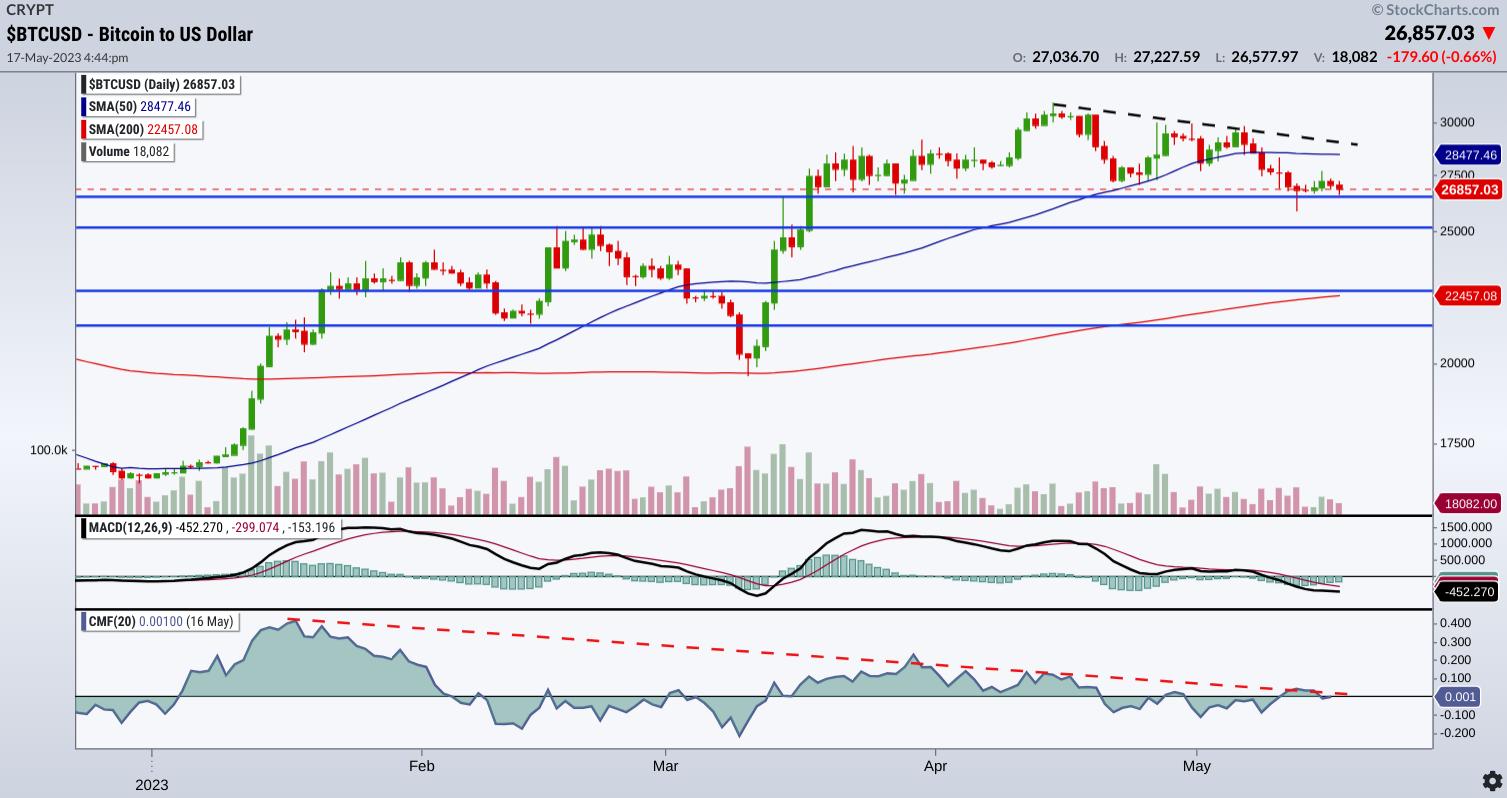
CHART 1: DAILY CHART OF BITCOIN TO US DOLLAR ($BTCUSD). Bitcoin is trading below its 50-day simple moving average, and the MACD and CMF indicators also look bearish. If Bitcoin continues falling, it could hit the $22.5k level or even lower.Chart source: StockChartsACP. For illustrative purposes only.
Having fallen below the 50-day simple moving average (SMA), the downtrending line starting in mid-April serves as a stronger resistance level the cryptocurrency must break through to maintain its upward trajectory. But that will likely not happen without a slight breather or a much deeper pullback.
Bitcoin is testing its two-month lows near the $26.6k range and will likely fall to $25k support. Notice that the Moving Average Convergence/Divergence (MACD) and particularly the Chaikin Money Flow (CMF) indicators both hold a bearish posture. Should Bitcoin continue falling, you can expect further support near the $22.5k and (further down) the $21.5k range.
There's also another way to look at this chart.
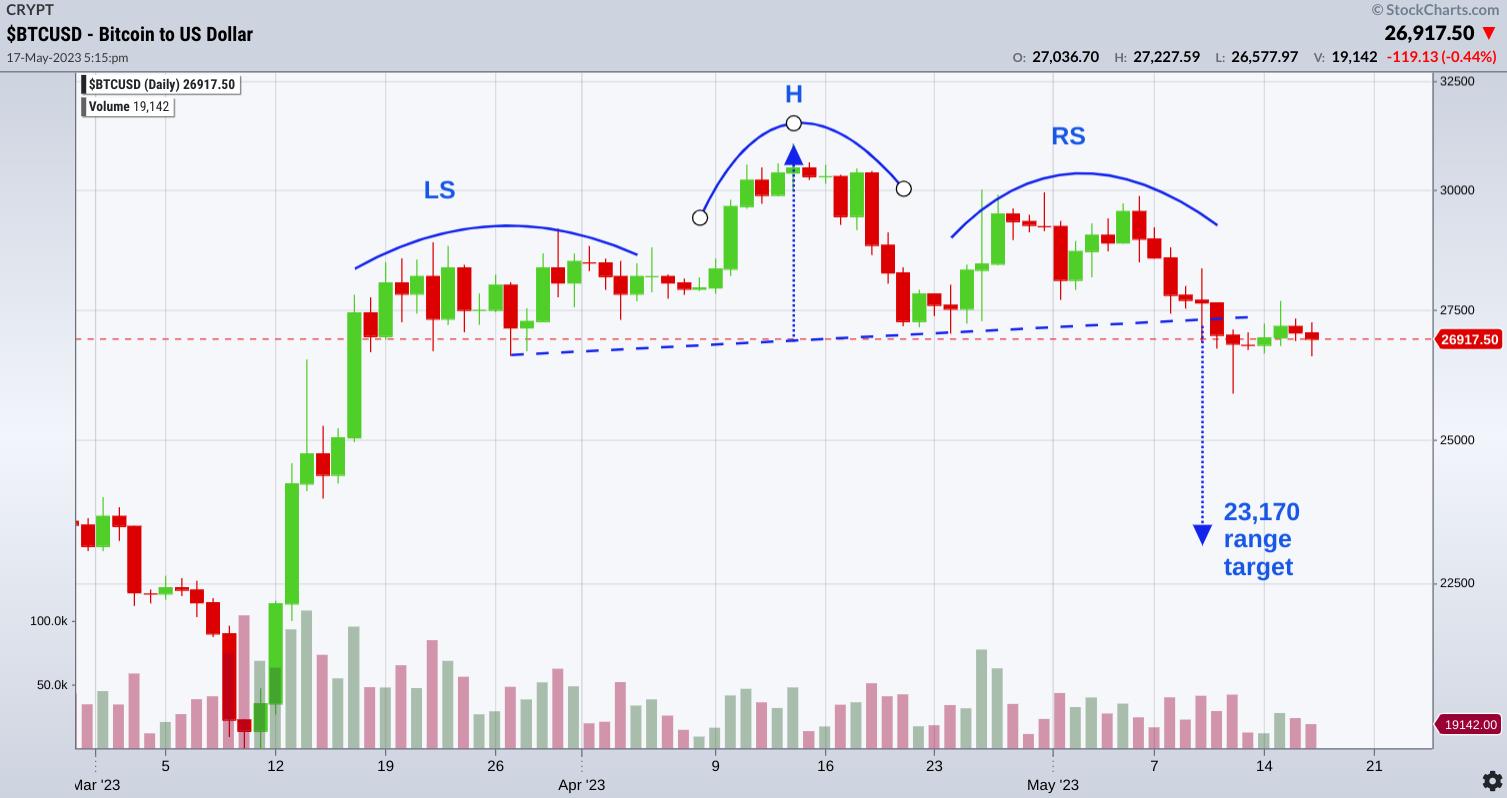
CHART 2: A HEAD AND SHOULDERS TOP IN BITCOIN. The downside target could bring Bitcoin to the $23,170 level.Chart source: StockChartsACP. For illustrative purposes only.
Viewing it from a Head & Shoulders top perspective, you can calculate the downside target by subtracting the top of the formation ($31,023) from the neckline ($26,900) and then subtracting the balance ($4,123) from the downside penetration of the neckline ($27,292) to get the target of $23,169 or $23,170 (to round up). This downside target is slightly above the resistance level of $22.5k, as noted in chart 1.
But is Bitcoin Technically Bullish or Bearish in the Long Term?
This is difficult to answer, but if you were to apply longer-term technical criteria to the crypto, similar to what was done in chart 2 for the near-term view, wouldn't it look like the chart below?
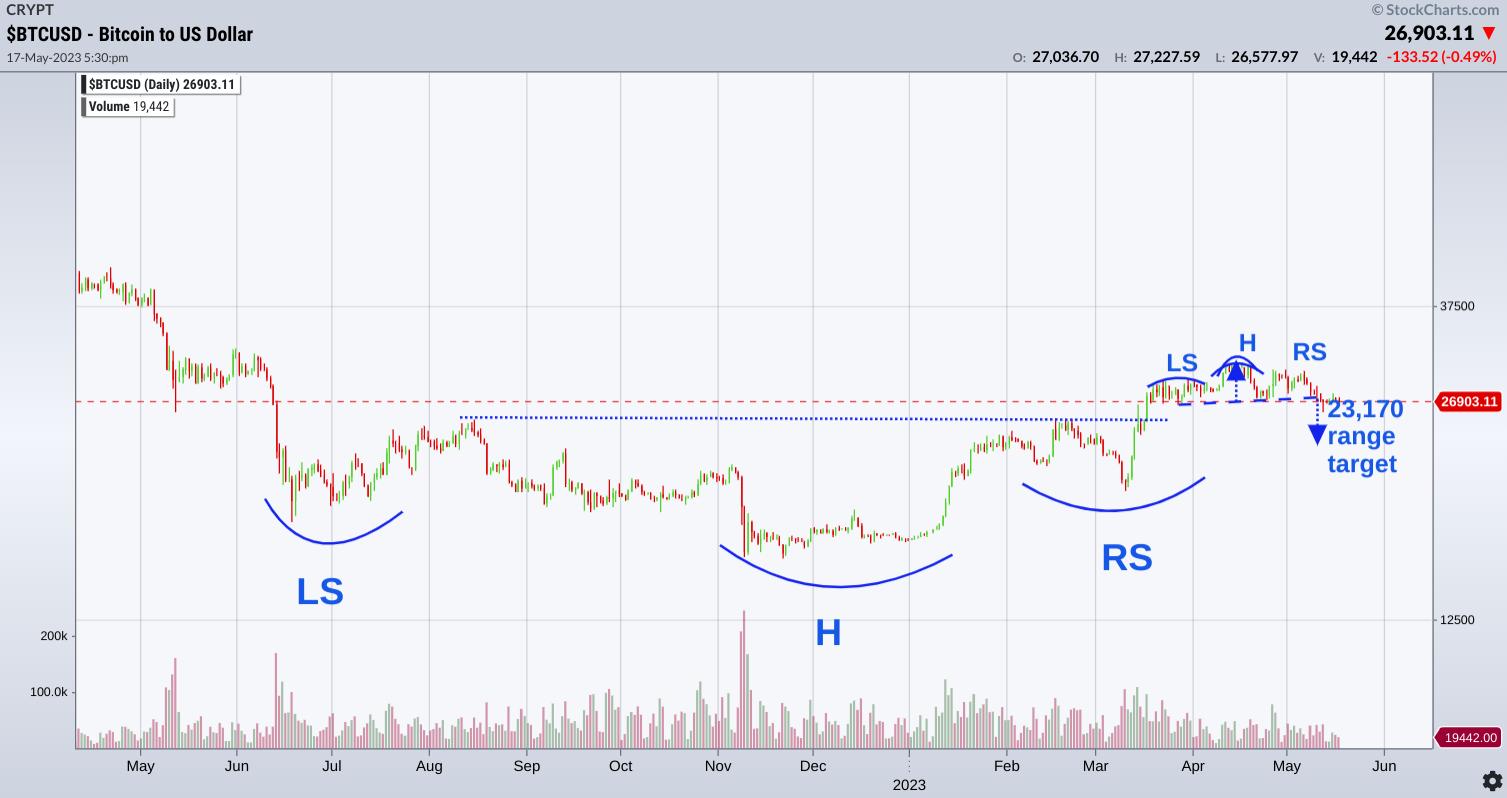
CHART 3: A LONGER-TERM VIEW OF BITCOIN. Maybe the target range of the smaller Head & Shoulders (H&S) will coincide with the larger H&S bottom.Chart source: StockChartsACP. For illustrative purposes only.
If you were to maintain this bullish thesis, then the smaller pattern (a break below the smaller H&S pattern) constitutes a break above the larger H&S pattern. In this case, you'd have to pick your time frame and monitor your trade accordingly.
The Bottom Line
Bitcoin's near-term technical landscape seems to be brimming with challenges. Fortunately, it faces a scaffolding of support levels. While the potential for a bounce-back always seems to exist in the volatile world of cryptocurrencies, the present indicators lean towards a bearish outlook in the short term. The application of various technical analysis tools all point towards possible further downward movement, with support levels identified between $25k and $21.5k.
Nonetheless, the longer-term outlook remains more ambiguous. If a larger bullish pattern prevails, the current bearish trend could be a smaller part of a larger upward trajectory. As always, the key to navigating this turbulent market lies in carefully monitoring the technical indicators and adjusting trading strategies accordingly.
The ongoing debate regarding the nature of Bitcoin as a "gambling" asset versus a "financial" asset adds a layer of complexity to the scenario. Ultimately, only time will unravel the true identity and trajectory of this pioneering cryptocurrency. Whether you're a bear or a bull, the thrill of the Bitcoin ride continues unabated.

Disclaimer: This blog is for educational purposes only and should not be construed as financial advice. The ideas and strategies should never be used without first assessing your own personal and financial situation, or without consulting a financial professional.
Happy charting!


