
The stock market has had quite a week. First, there was JP Morgan Chase (JPM)'s takeover of First Republic Bank (FRC). Then came the warning from Janet Yellen that the US may hit its debt ceiling as early as June 1. That's a lot to digest, especially the news about the debt ceiling, since most investors weren't expecting it to come so soon.
What could happen if the US defaults on its debt? It could send the stock market spinning; people may not get their monthly benefit checks, and some parts of the government could shut down, at least for a while. In short, there could be major chaos.
Those who were engaged with the financial market in the last 12 years may remember what took place during the debt ceiling debacle in 2011. To refresh your memory, the stock market plummeted, and S&P downgraded the credit rating of the US. And that had repercussions the following year—the cost to borrow shot up, and there were many cost cuts.
Could a similar situation take place this year? Let's hope that doesn't happen, but, to be prepared, it doesn't hurt to do a chart analysis that identifies the various potential support and resistance levels.
Debt Ceiling 2011 vs. 2023
The broader indexes—the S&P 500 index ($SPX), the Dow Jones Industrial Average ($INDU), and the Nasdaq Composite ($COMPQ)—have been within a trading range for the last six months or so. And if you look at the historical charts, a similar scenario unfolded in 2011. From February to July, the S&P 500 index moved sideways (see chart below). At one point, it looked like the index might trend higher, but, alas, it fell by quite a bit. We're talking from about 1350 to 1120; that's approximately a 17% drop within a few weeks. And look at the CBOE Volatility Index ($VIX)! After hanging out below the 20 level, it spiked to almost 50.
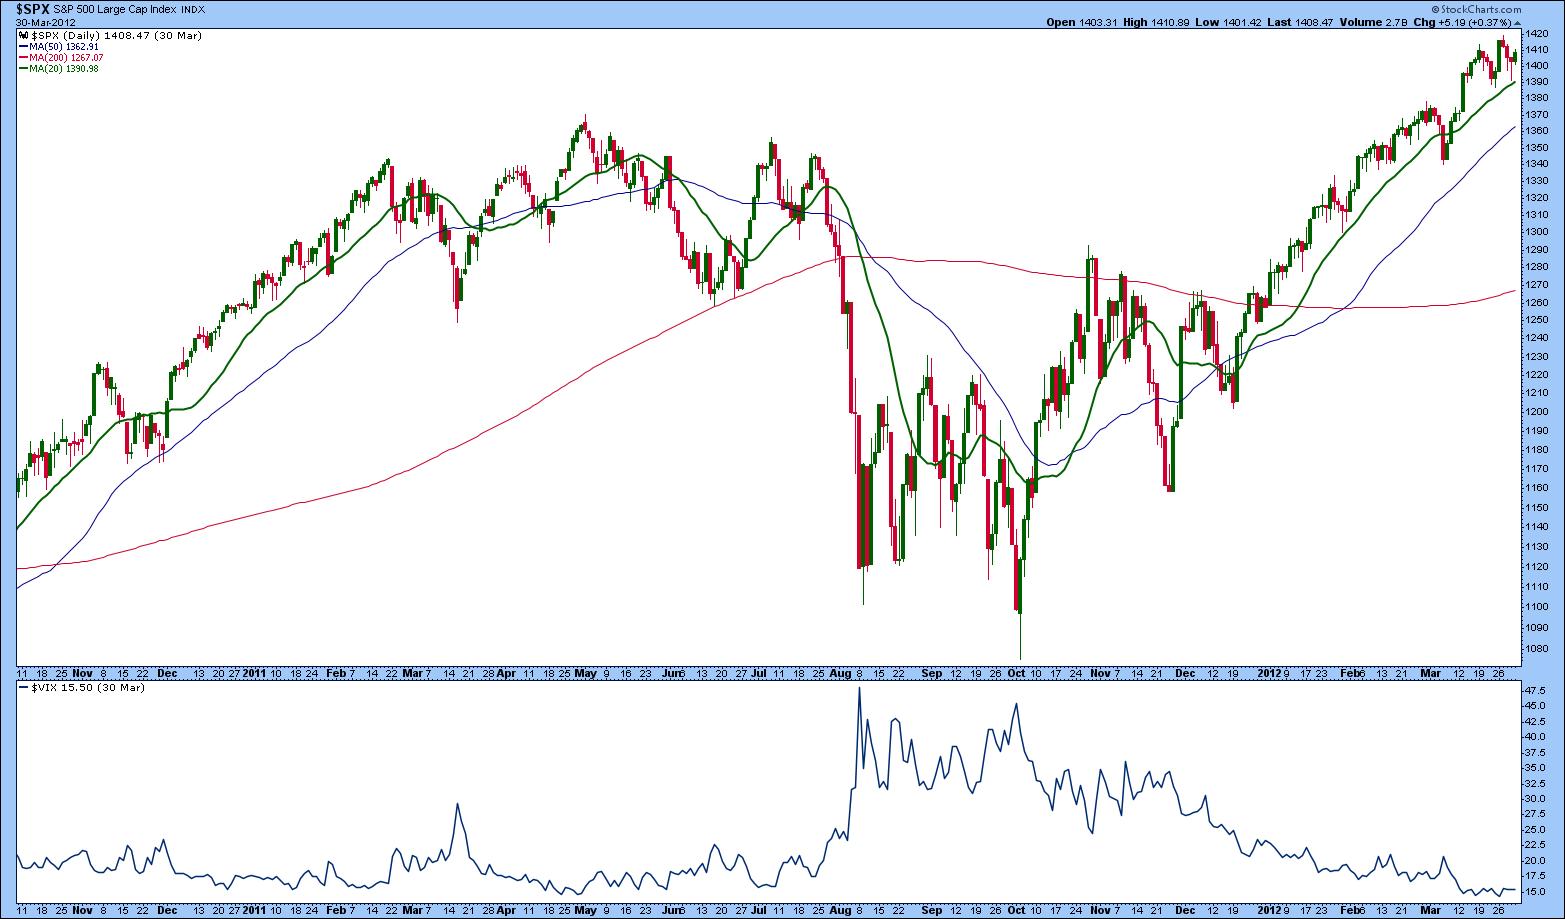
CHART 1: S&P 500 INDEX DURING THE 2011 DEBT CEILING FIASCO. The index fell approximately 17%, and the VIX spiked.Chart source: StockCharts.com. For illustrative purposes only.
Not to scare anyone, but this may be a chart you want to save in one of your ChartLists, since a similar scenario could play out as we approach the debt ceiling "X-date." And if that date happens to be June 1, that's not too far away.
In the chart above, the market bottomed in October, after which the S&P 500 started rising. And the VIX dropped lower to its normal range of less than 20. After the three-month hiccup that lasted from August to October, the market continued its journey higher.
The VIX could be one of the most important indicators to watch ahead of the debt ceiling X-date. It's retreated to its pre-COVID levels, staying below the 20 level. If it starts turning higher and moves in that direction while the index starts to drop, similar to what happened in 2011, it may be a good idea to stay on the sidelines and wait until market stability resumes. If history is any indication, the wait may only be a few months.
If you turn your attention to the monthly chart of the S&P 500 index below, it looks like the market is trying hard to keep the rally going, following the upward slope of the 50-month moving average, which could act as a support level.
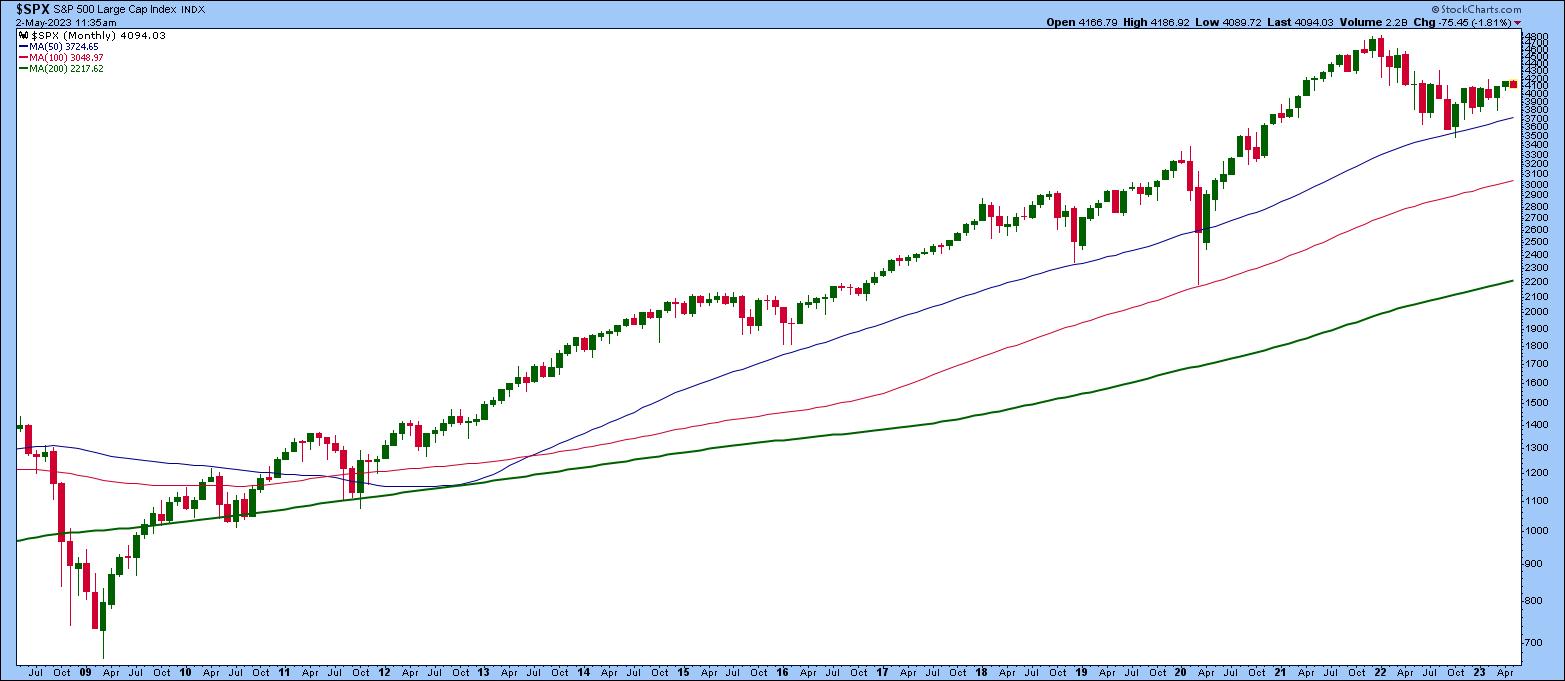
CHART 2: MONTHLY CHART OF S&P 500 INDEX. Looking at a longer-term chart helps to see a "big picture" view of the market. The S&P 500 is still trending higher, as indicated by its 50-, 100-, and 200-month moving averages.Chart source: StockCharts.com. For illustrative purposes only.
Does a shorter-term chart also show an uptrend? Let's turn to the daily chart of $SPX and add Fibonacci retracement levels to it (see chart below). Using the January 2022 high and October 2022 low, the Fibonacci retracement levels show the 50% level at 4155.10 as a resistance level. The S&P 500 has tried to break above this resistance level, but it lacks the follow-through.
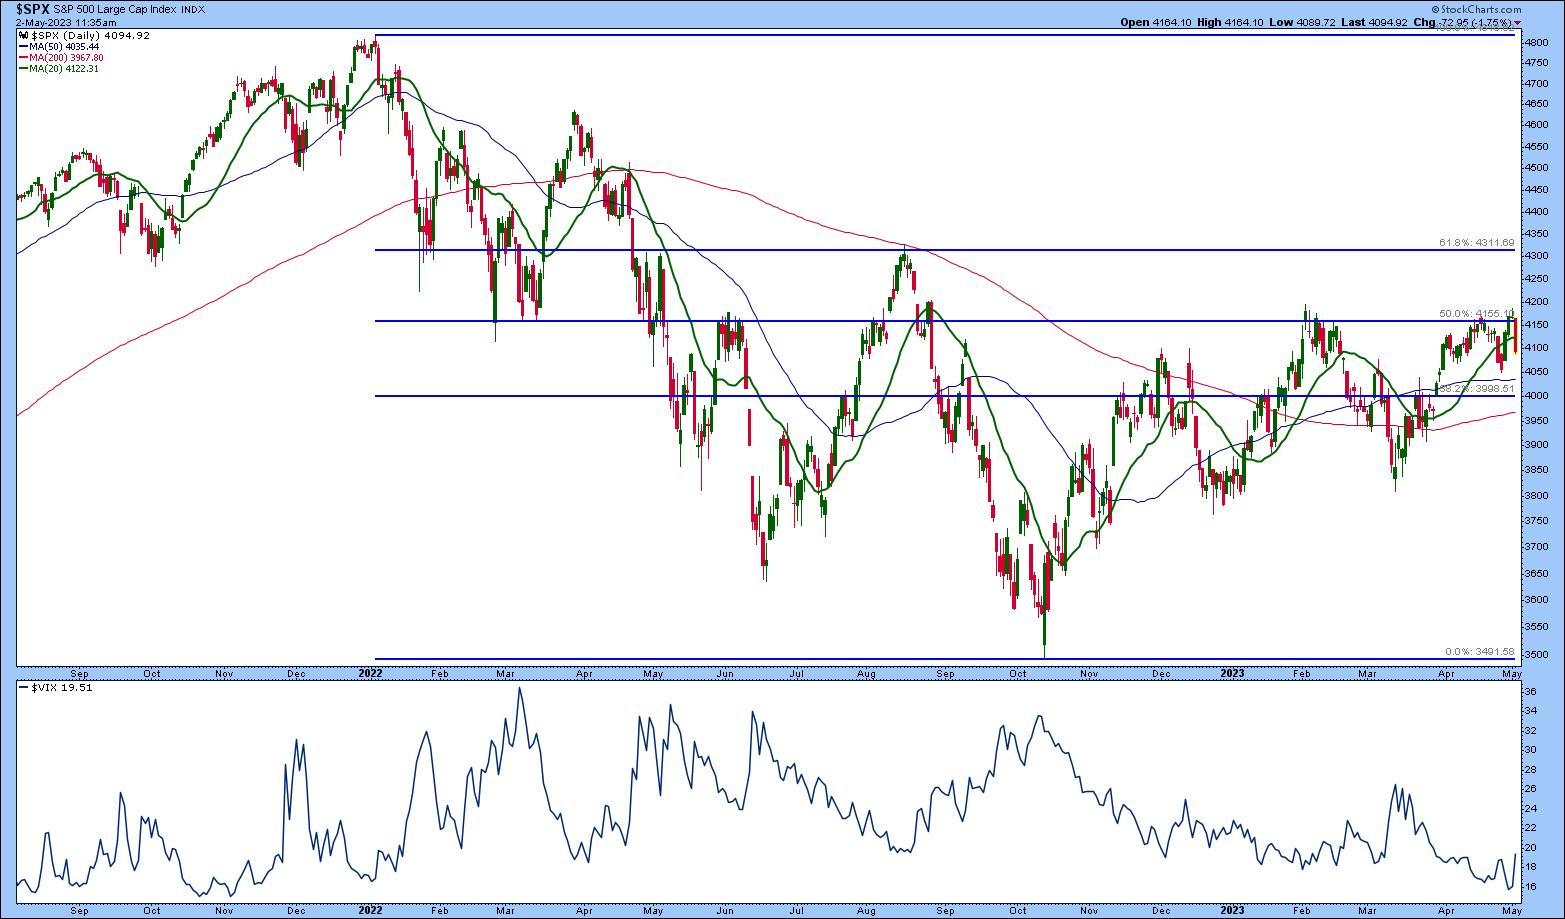
CHART 3: FIBONACCI RETRACEMENT LEVELS AND VIX. The S&P 500 index could move between the 38.2% and 50% Fibonacci retracement levels if things remain the same. but if the debt ceiling X-date comes earlier than expected, it could fall as low as its October low. And the CBOE Volatility Index ($VIX) is creeping up.Chart source: StockCharts.com. For illustrative purposes only.
How things unfold is anyone's guess, but it may be worth keeping an eye on movements in the S&P 500 with respect to the different Fibonacci retracement levels. It could continue to move between the 50% and the 38.2% levels if things remain the same and the debt ceiling X-date stretches out by a few months. But if June 1 becomes a reality, then the S&P 500 could fall to its October low of 3491. That's a little more than a 16% drop, which is almost in line with the drop that occurred in 2011. And the VIX is starting to creep up. Keep an eye on that.
The Bottom Line
This may be a little too close for comfort, but don't rule out anything when it comes to the stock market. You could do a similar analysis with the other indexes to see if a similar picture emerges. There's a Fed meeting coming up, earnings season will wind down, and you have to decide if you should sell in May and go away.
Keep Your Dashboard on your radar. It'll help you identify which areas of the market are outperforming and which ones are underperforming. If there's a replay of 2011, at least you'll be better prepared and ready to jump into the outperforming asset classes. The best you can do to become a smarter trader or investor is to stay on top of market-moving commentary.

Disclaimer: This blog is for educational purposes only and should not be construed as financial advice. The ideas and strategies should never be used without first assessing your own personal and financial situation, or without consulting a financial professional.
Happy charting!


