
Scanning the market for a tradable "event" might get you an express ticket to the "fast money" line of opportunity and risk. Bear in mind that an "event" is something that has already happened. Jumping on the opportunity means you'll be a little late to the game, but, sometimes, the technical scenario may be strong enough to justify your late response.
Such is the case for Breakaway Gaps on high volume, whether up or down.
What is a Breakaway Gap and What Makes It a Potentially Favorable Trade?
A breakaway gap occurs when a stock opens higher (or lower than) its previous day's closing price in a "counter-move" that "breaks away" from a short-term trend, congestion level, or area of support and resistance. As for what makes them favorable, breakaway gaps have strong performance stats under the right set of conditions (note, many of the ideas below are from Thomas Bulkowski's Encyclopedia of Chart Patterns):
- Breakaway gaps often signal the start of a new and sustained trend or the resumption of a prevailing trend (following a pullback).
- Breakaway gaps on high volume that move toward a larger prevailing trend tend to have the strongest performance.
- Breakaway gaps often result from a sudden and significant shift in market sentiment (which tends to lead to a sustained move in the direction of the gap).
- Breakaway gaps have a low rate of being filled within the week of the gap (around 1%)
- Median time for breakaway gaps to be filled is 85 days for upward gaps and 84 days for downward gaps.
Overall, breakaway gaps provide appealing trading possibilities due to their consistent directional and statistical nature. It's essential to quickly analyze and capitalize on the most favorable situations, as these opportunities can be short-lived.
How to Scan for Breakaway Gaps
From Your Dashboard, head to Member Tools and scroll to Sample Scan Library. Then, click on "Run" for Breakaway Gap Ups.
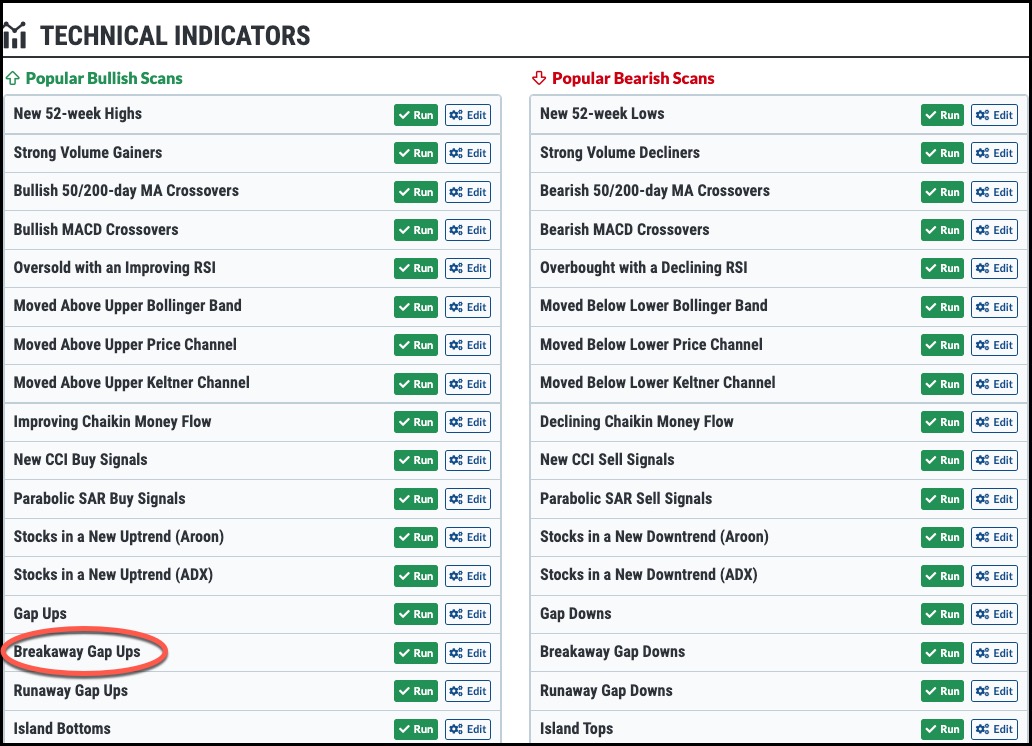
Since there are two scans for either direction—Breakaway Gap Ups and Breakaway Gap Downs—let's focus on gaps up for the sake of simplicity.
While, on some days, you may get plenty of scan results, on other days, you may end up with very few (likely due to market conditions). This morning we have only two results: Molson Coors Brewing Co (TAP) and CVR Partners LP (UAN). The fewer scan results you have to work with, the smaller the pool of "quality" candidates you have to work with.
Let's look at TAP (see chart below), a company many of you might be familiar with.

CHART 1: UP, UP, AND AWAY. Molson Coors (TAP) gapped up above its June 2021 high. Chart source: StockCharts.com. For illustrative purposes only.
A lot is going on in this chart. The breakaway gap catapulted price above the two-year high (June 2021) high.
But what did it "breakaway" from? There are a couple of ways to look at it: A two-year narrowing trading range with plenty of smaller areas of thick congestion. On the other hand, if you mark the series of lower lows over two years, you can see that, arguably, the "trend" (if we can even call it that based on the higher swing lows) is more or less upward and against a two-year resistance level, making for a strong case in favor of this particular gap event.
Let's zoom in for a closer look.

CHART 2: BREAKAWAY GAP ON TAP. Looking at the daily chart, TAP's price closed above its upper Bollinger Band. The Stochastic Oscillator and RSI are in overbought territory.Chart source: StockCharts.com. For illustrative purposes only.
While breakaway gaps typically don't get filled for a median of 85 days, the close above the upper Bollinger Band (and the current response to that close) might have us thinking that the current gap will likely be an exception. Price tends to revisit the middle band after such a move, and its current level below 68 is well below the breakaway gap range. Meanwhile, the relative strength index (RSI) and Stochastic Oscillator are clearly signaling "overbought," yet both those levels can remain on the upper threshold for an extended period.
At this point, it helps to bring in the fundamentals. The breakaway gap was a market response to TAP's Q1 earnings which say a 109.11% surprise in earnings (EPS of 0.54 vs. 0.25 expected) and a 5.38% revenue beat (a surprise of $119.70 million over estimates).
So, might it make for a favorable trade, considering the technical setup, historical stats, and fundamentals context? We'll leave that up to you. Remember, the point of this article was to highlight a scan process for potential high-probability trading setups.
The Bottom Line
Breakaway gaps offer an intriguing opportunity for traders to capitalize on a pattern with strong directional and statistical characteristics. By actively scanning for these gaps, traders can pinpoint potential high-probability setups, even if they're a little late to the game. It's essential to carefully evaluate the technical scenario and underlying fundamentals before making any trading decisions, as each trader's risk tolerance and strategy will vary.
One point to emphasize is that if you take the initiative to scan and analyze market events actively, it can reveal hidden trading opportunities that might have been easily overlooked otherwise. That's what the scanning software is designed to do, and we hope you can take advantage of it in a way that enhances your overall market performance.

Disclaimer: This blog is for educational purposes only and should not be construed as financial advice. The ideas and strategies should never be used without first assessing your own personal and financial situation, or without consulting a financial professional.
Happy charting!


