
When inflation is a huge concern, you'd think the stock market would celebrate in a big way when inflation shows signs of cooling. Not so much.
April consumer price index (CPI) and producer price index (PPI) data came close to estimates. Headline CPI rose 0.4% in April and 4.9% from a year ago. And core CPI, which excludes food and energy, was up 0.4% in April and up 5.5% year-over-year. Services inflation, a number the Fed has been watching closely, rose 0.3%, which is still high. April PPI numbers also showed a similar trend. Headline PPI was up 0.2% in April and up 2.3% from a year ago. And core PPI was up 0.2%, mostly due to the 0.8% decline in auto prices.
The Fed Can Chillax
Although some areas could see more cooling, the overall data shows that inflation continues to decline. And that could be good news for the Federal Reserve. After 10 interest rate raises, their efforts may be starting to impact the economy. The stock market may not be throwing a party, but maybe the Fed could have a more relaxed meeting in June—not a bad way to prepare for the summer months.
The stock market breathed a sigh of relief, or at least that was its initial reaction after the CPI news was released. But during the trading day and the following day, after the PPI was released, the market didn't do much, except for growth stocks. And that could be because of the price action in the bond market.
Treasury yields dipped lower on the cooling inflation news, a scenario that tends to favor growth stocks. So it's no surprise that investors flocked to stocks in the Technology and Communication Services sectors. Look at Alphabet, Inc. (GOOGL). The stock, after moving sideways for months, finally showed signs of breaking out above a trading range. A big catalyst behind the rise: Alphabet's massive investment in AI at its annual I/O conference. Will it last? That remains to be seen.
Putting It All Together
A 4.9% headline inflation is still higher than the Fed's 2% objective. But 4.9% is lower than the federal-funds futures rate. This could mean that current interest rate levels may slow down the economy enough to get inflation closer to the Fed's 2% target. This would be a best-case scenario. The labor market and shelter costs are still sticky points in the inflation data, but there seems to be enough data to support a pause in rate hikes.
Signs of a slowing economy, banking sector woes, Disney's (DIS) weak earnings, and a decline in business loan demand suggest that things still need to be sorted out. So we'll see how things unfold between now and June 13.
A stickier point is the looming debt ceiling, which could be playing its part in preventing the broader markets from busting through their critical resistance levels. The Nasdaq 100 index ($NDX) is probably the one index that's shown strong performance because of the high representation of growth stocks—Meta (META), Apple (AAPL), Alphabet (GOOGL), Nvidia (NVDA), Microsoft (MSFT), and Netflix (NFLX). (See chart below.)
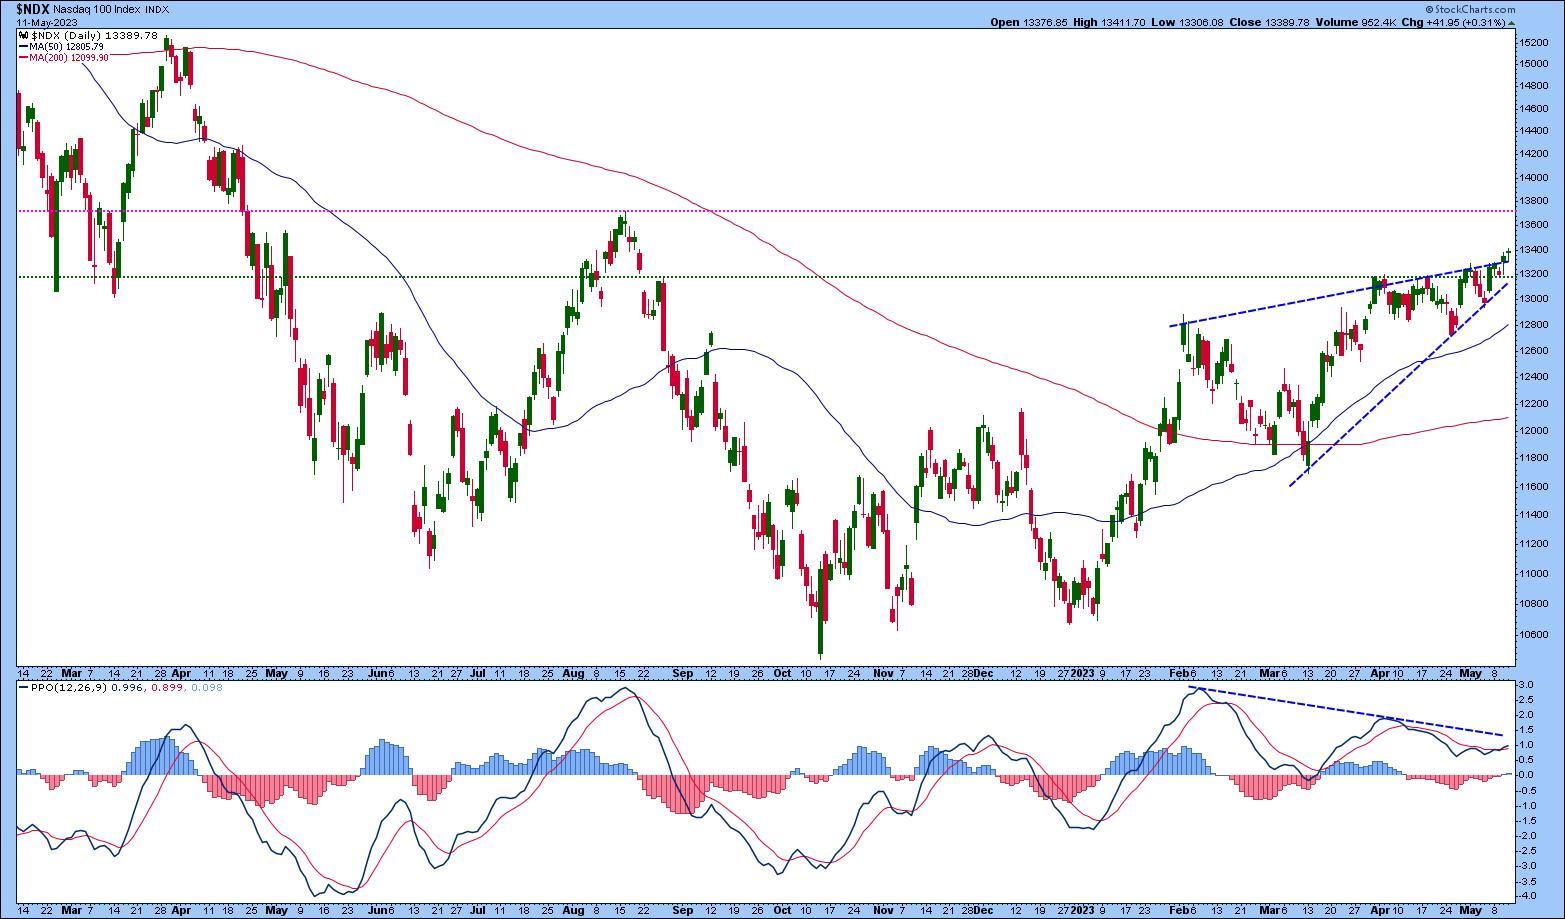
CHART 1: NASDAQ 100 INDEX COULD SEE A BULLISH RALLY. If the index continues higher and the percent price oscillator (PPO) rises and breaks above the downward-sloping dashed line, it could add momentum to the index.Chart source: StockCharts.com (click on chart for live version). For illustrative purposes only.
A couple of points to keep in mind when viewing the chart are as follows:
- $NDX has crossed above its 13175 (green dashed horizontal line). If the upward trend continues, $NDX could rise to its August 2022 high of about 13721 (pink dashed horizontal line).
- If you look at the dashed blue lines in the price chart, you'll see that $NDX has crossed above the top trendline. It has to stay above that trendline for the uptrend to continue. A breach below it could be trouble.
- Another indicator to watch is the percentage price oscillator (PPO) in the lower panel. There's a divergence between price action and the PPO, which could be a bearish signal going forward. But if the shorter moving average crosses above the longer moving average and both lines move above the downtrending blue dashed line, it could be positive for $NDX. If the index trends higher in conjunction with the PPO, there could be a strong bullish path up ahead, at least up until the next resistance level.
The Bottom Line
Even though growth stocks are performing better than other asset groups at the moment, we're not out of the woods yet. If you're trading heavily-weighted Nasdaq 100 stocks, you want to monitor some macro events, such as the debt ceiling and the banking crisis. These events, or something else you least expect, can change market direction on a dime.

Disclaimer: This blog is for educational purposes only and should not be construed as financial advice. The ideas and strategies should never be used without first assessing your own personal and financial situation, or without consulting a financial professional.
Happy charting!


